Note: the author benefited from a licence from the Canadian Hydrographic Service and from SEAiq to write this text.
This text is the last of five on electronic navigation applications. It covers the use of the SEAiq – Pilot software. This software enables you to work with S-100 charts, the latest electronic chart format. These charts are available in the United States, and will shortly become available in Canada.
In a similar way to the other texts in this series, I illustrate how to use the application combined with the new charts to accomplish eight important navigation-related tasks:
- obtaining electronic charts;
- reading symbols on the chart;
- measure distances and angles;
- find out about currents and tides;
- assess your speed and course over the ground;
- plan and execute routes;
- exchange routes already planned;
- record the actual route taken.
The other texts in this series cover the use of the Navionics (Boating), OpenCPN, Savvy Navvy and C-MAP applications. As prior reading, the texts Introduction to Electronic Charts and Introduction to Electronic Navigation Applications cover knowledge required for this text.
I installed the application on an iPad with a built-in GNSS (GPS) receiver and on my personal computer (a Mac). Some screenshots are taken from the computer, but the text below – and most of the images – are taken from the tablet.
SEAiq – Pilot
SEAiq (Sea IQ) is an electronic chart display application aimed at navigation professionals. The application is available on Windows, Mac, iPads and iPhones. It is not available on Android.
SEAiq charges separately for the use of the application and for obtaining charts. The application can be purchased via a monthly (so-called “enterprise”) subscription, which offers ongoing support and installations on more than one device. In 2025, the price is $42 per month. It can also be purchased as a single payment (so-called “leisure”), including a single installation and limited support. In 2025, the price of this installation is $70. Chart prices vary from suppliers and countries. American charts are free, but charts produced by the United Kingdom and by Canada are not.
The “enterprise” subscription thus costs $504 per year in 2025 – without charts – compared with Navionics, which charges $80 per year – including all the charts for North America. For the tasks covered in this text, the usage price is high. To assess whether the price is worth it, an understanding of the application’s other features is necessary.
SEAiq integrates several services into a single subscription. It displays maritime traffic in real time, and allows you to view currents, winds, tides, navigational warnings and bathymetry in much greater detail than a conventional navigation application. It is also designed to be connected directly to pilots’ own portable instruments and includes an anchor watch mode. The added value of SEAiq is thus the integration of otherwise disparate information, and its integration within a single screen. As far as I’m concerned, I find the application attractive because it is able to interpret and display the new S-100 chart format.
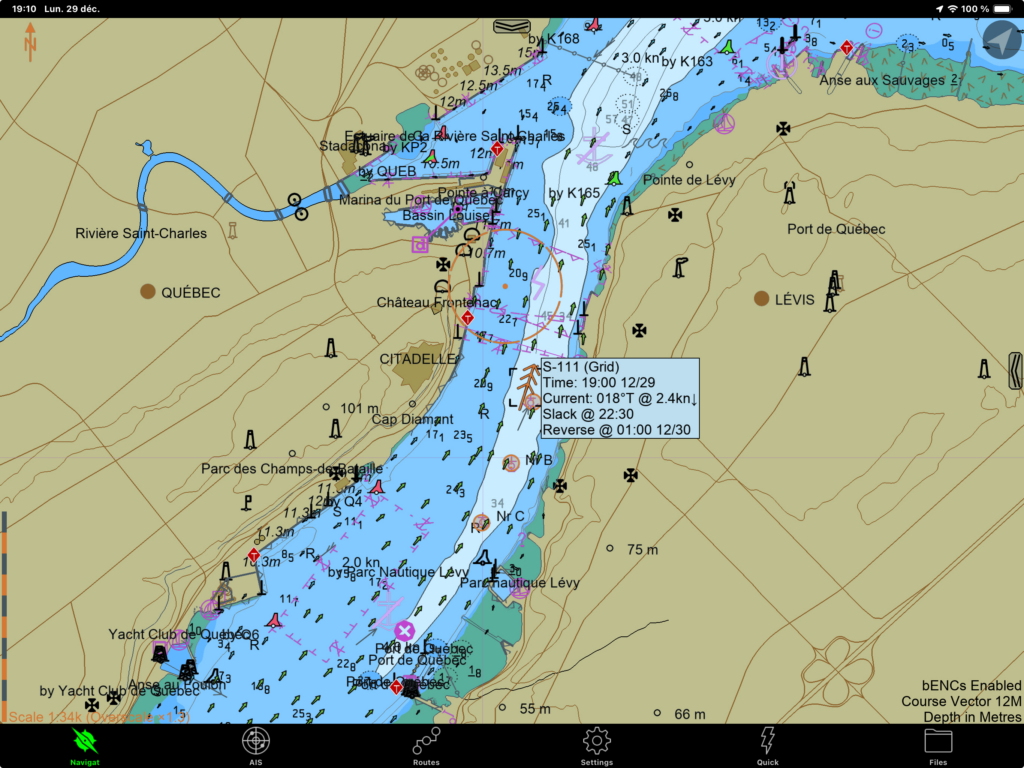
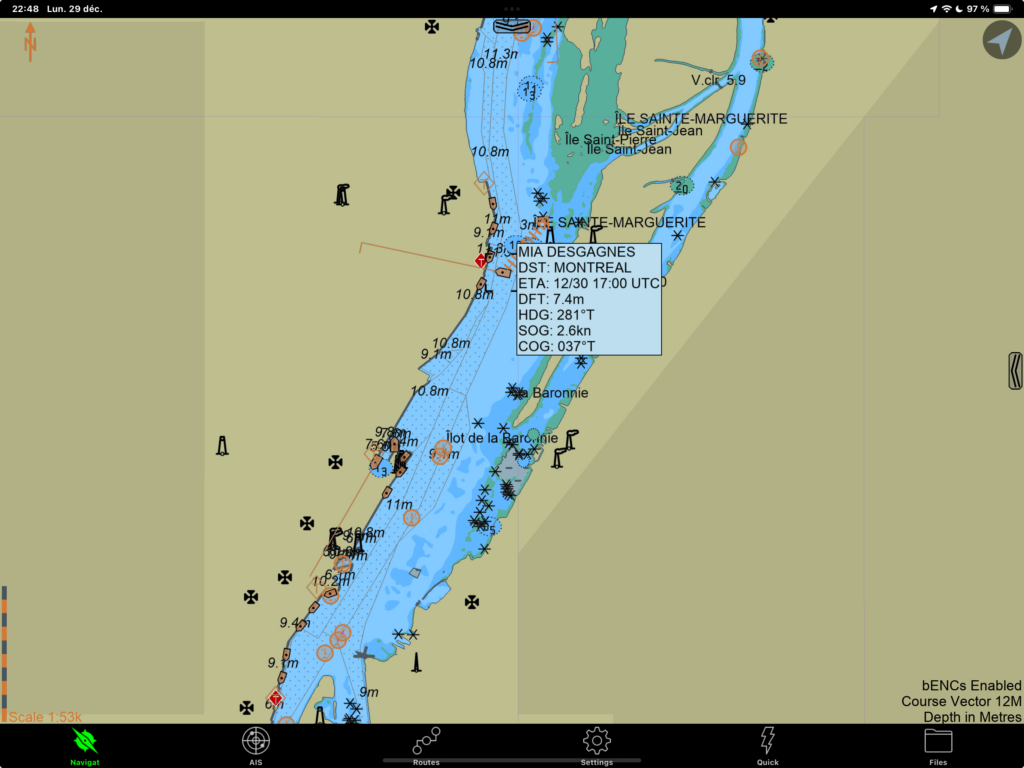
The image above shows a dynamic S-100 (technically S-111) standard chart displaying currents and navigation warnings in real time. The image at the beginning of this text also shows charts of the port of Montreal, including navigation warnings and its traffic in real time. In short, SEAiq offers much more than what is covered in this text.
Obtaining electronic charts
In a similar way to OpenCPN, electronic charts can be purchased within the application and, in the case of paid charts, by linking the app to an account with a chart provider. In the first section, I detail how to obtain American charts (free) and in the second, how to obtain Canadian charts (from Primar).
American charts
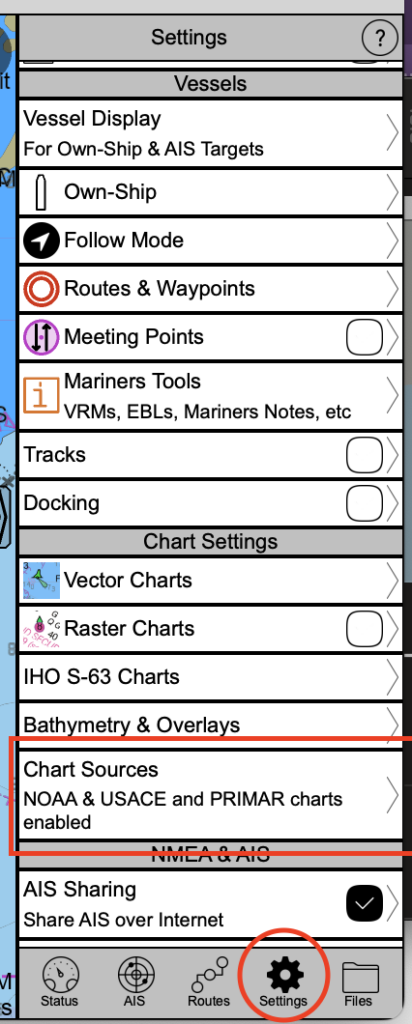
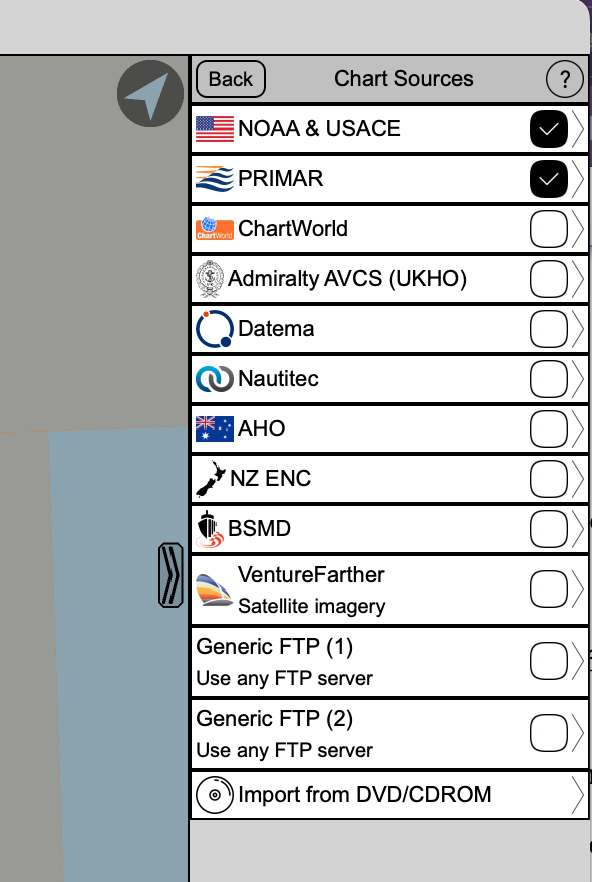
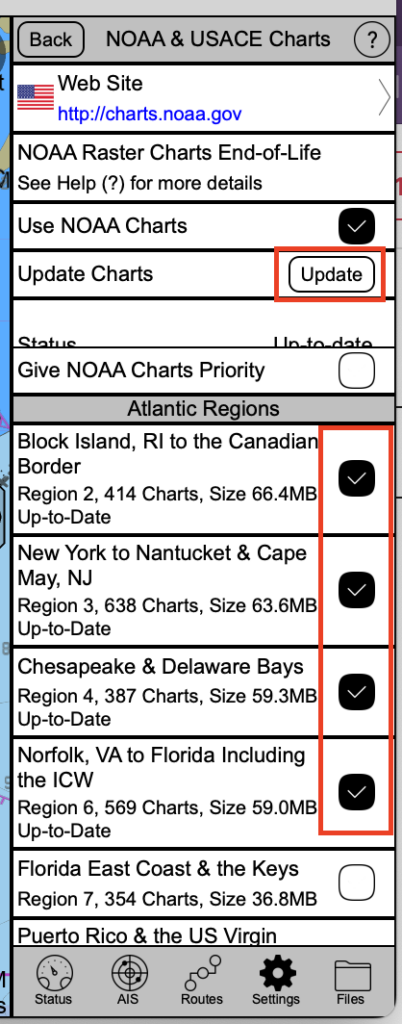
American charts can be downloaded for free from the application (see images below). Go to the Settings menu, then to the Chart sources menu. In this menu, tap on the NOAA & USACE source and then tap on the associated tab. Then tap on the Use NOAA Charts button and select the charts you want from the menu list.
The final step is to download the charts. Click on the Update button. The software will then start downloading the charts. The size of the download depends on the number of charts you selected in the previous step, and can range from a few megabytes to a few gigabytes. It is preferable to download them over a wifi connection rather than on a cellular one. (Note: you can also download NOAA maps directly from their website).
Canadian charts
Canadian Hydrographic Service S-100 charts are available through PRIMAR. PRIMAR is a non-profit organisation run by the Norwegian Hydrographic Service. It coordinates the efforts of various countries to develop and disseminate S-100 electronic chart standards.
The Canadian charts are not free of charge, so you need to obtain a licence from Primar. Primar will ask you for the user permit generated by the SEAiq application that is for S-100 charts (there is a different user permit for S-57 charts). You will need to provide PRIMAR with this permit, which will enable them to associate your purchases with your software. You will then only be able to download charts from the application that has the user permit indicated.
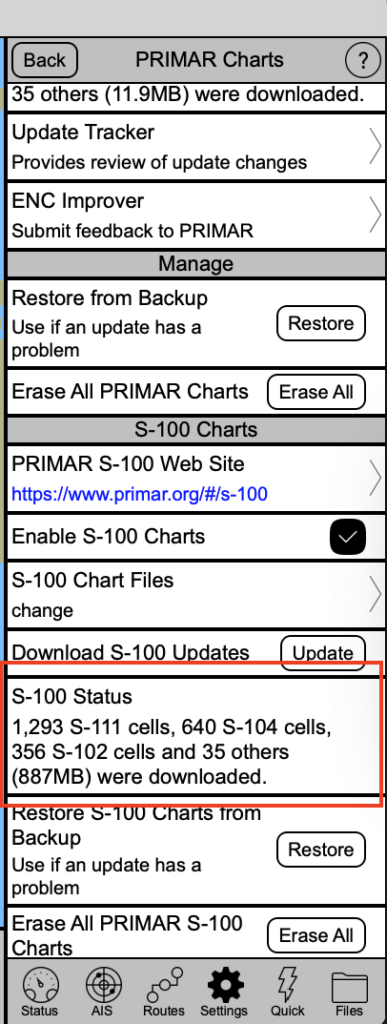
From then, it is the same procedure as for US charts: go to the settings menu, then the Chart sources menu, select Primar, then press the Update button. The charts for which you have paid a subscription will then be downloaded.
Note that it is also possible to download charts directly from the PRIMAR site (once the licence has been paid for). You will then have access to the S-100 products in downloadable format (image below). I haven’t explored this option, but this approach might be preferable for other applications.
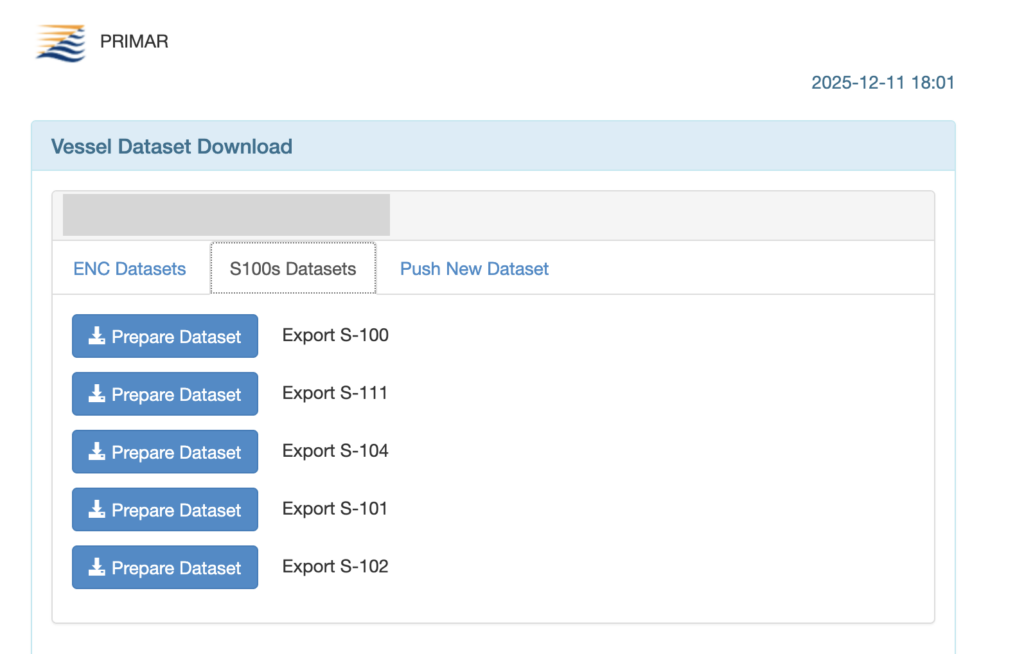
The downloaded charts are stored directly on your device. Once the download operation is complete, you no longer need an internet (or cellular) connection to use the charts.
Reading symbols
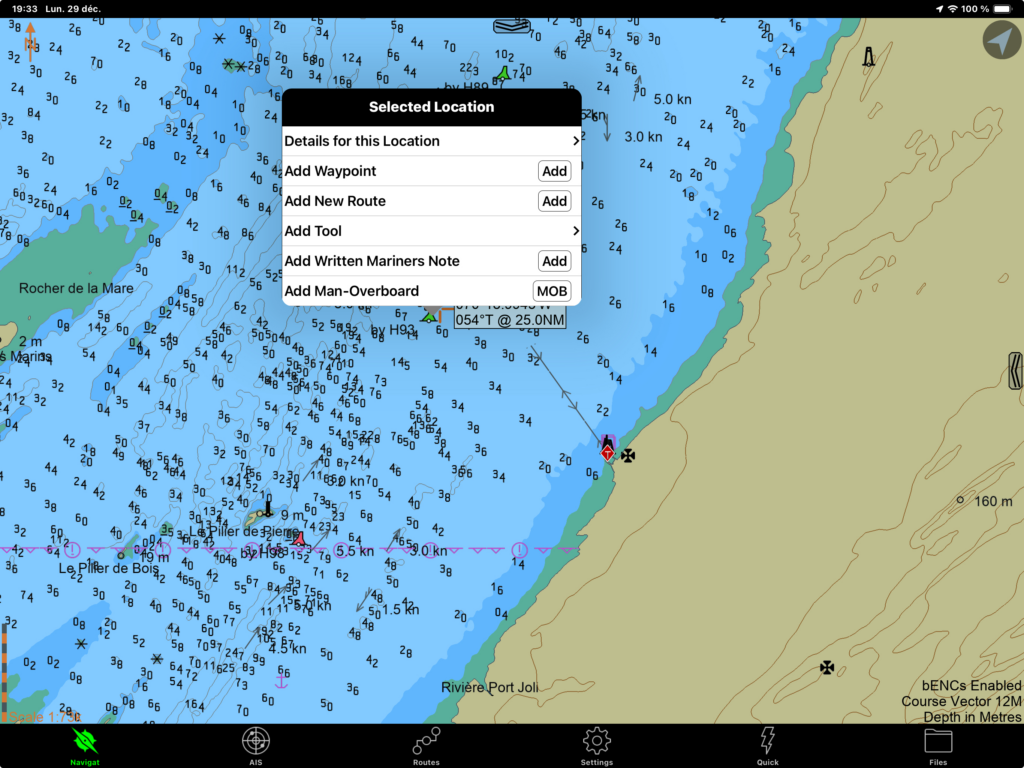
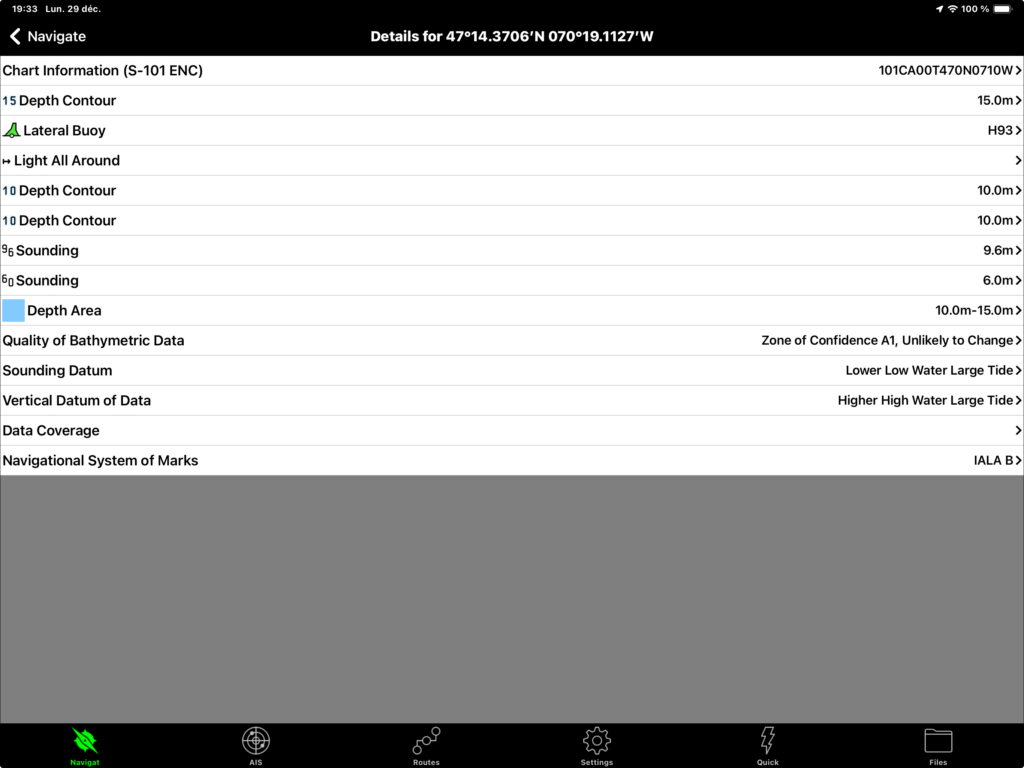
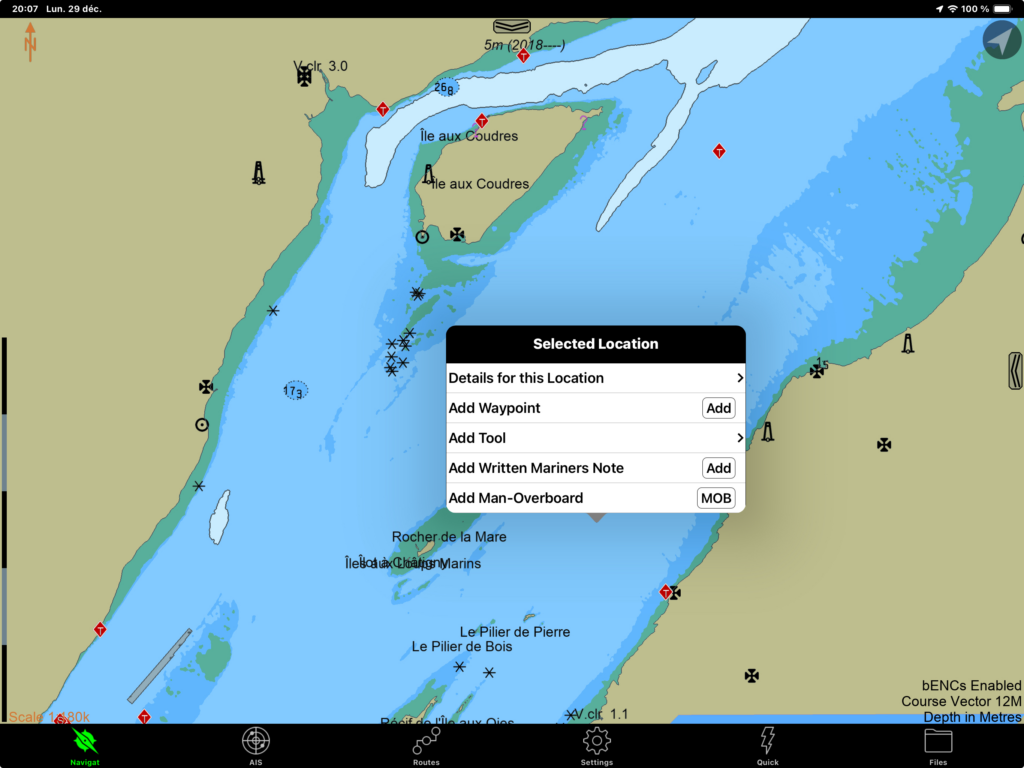
To read symbols on a chart, simply double-tap on a symbol. A pop-up menu then appears, and tapping on Details for this location takes you to the sub-menu that details all the objects at the tapped location on the map. Finally, tapping on the object of interest in the menu brings up its information.
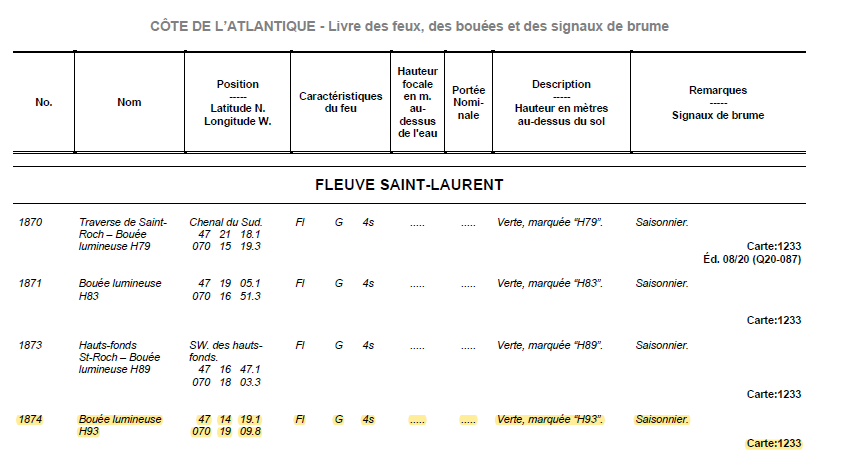
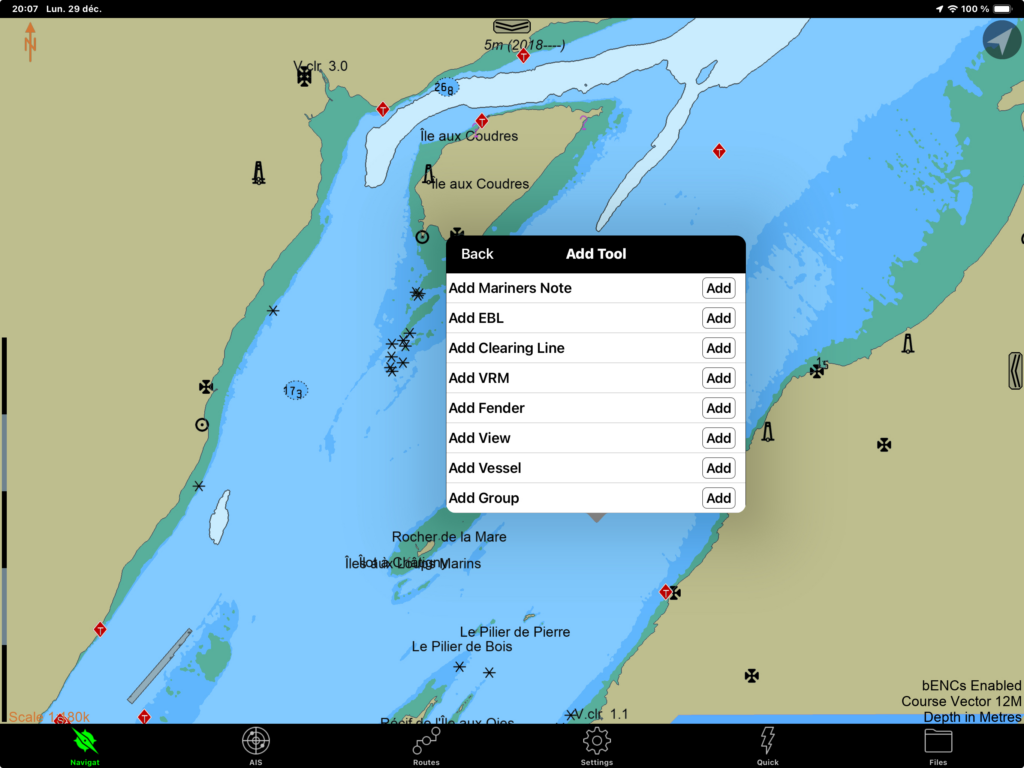
Below, I illustrate how to do this by selecting buoy H93, near Saint-Jean-Port-Joli. This buoy is on Canadian Hydrographic Service chart 1233. The first image (below) shows the context menu displayed immediately after tapping on the buoy. The second image shows the context menu, displaying each of the layers or objects present at this point on the chart. The third image shows information specific to buoy H93.
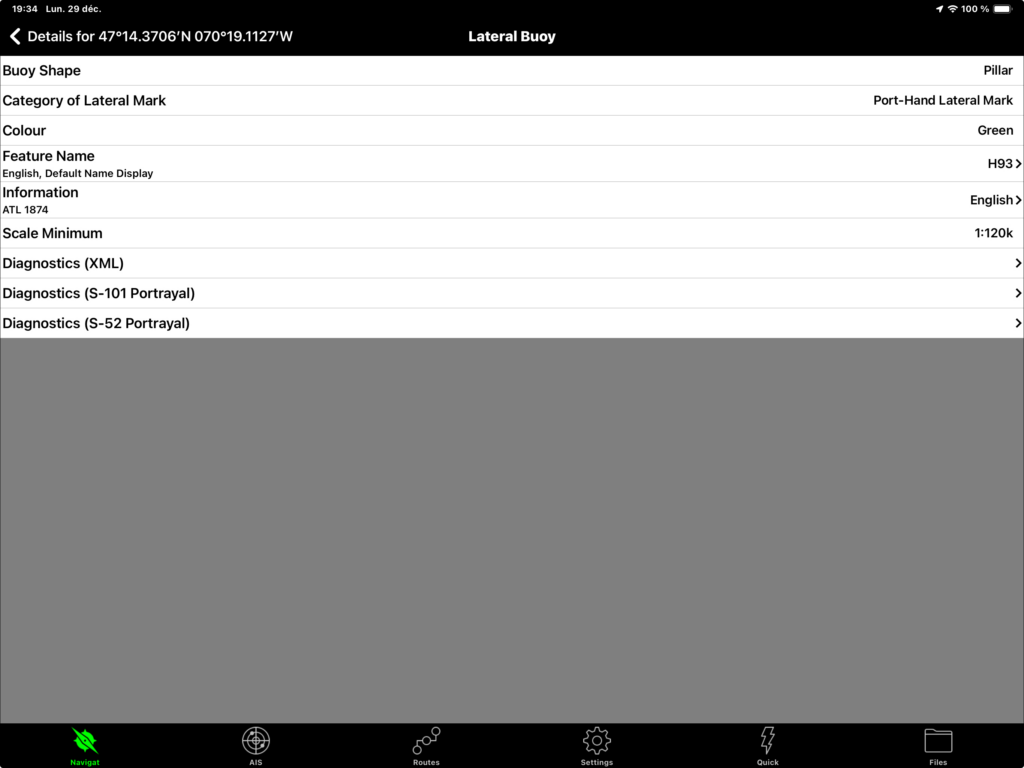
This information is consistent with that obtained from the book of lights, buoys and fog signals. However, information about its seasonal nature is missing from the application.
Three features of the application should be noted with regard to the information available. Firstly, all chart objects are accessible. This is a stark contrast with other applications, where only navigation objects are accessible.
Secondly, you sometimes have to be patient to access the map object that interests you: the double-tap action is very sensitive and the application sometimes detects ‘neighbouring points’. You then have to start again. While the use of a moving crosshair, as in the Navionics application, is initially counter-intuitive, its value becomes clear by comparison, as it is easy to select an object that interests you.
Thirdly, the application would be able to display seasonal information if this information was detailed in the navigation warnings. SEAiq could then display it directly on the buoy.
Measuring distances and angles
To my knowledge, SEAiq does not have a dedicated instrument for measuring distances and angles. The most convenient alternative tool is the EBL, which stands for electronic bearing line.
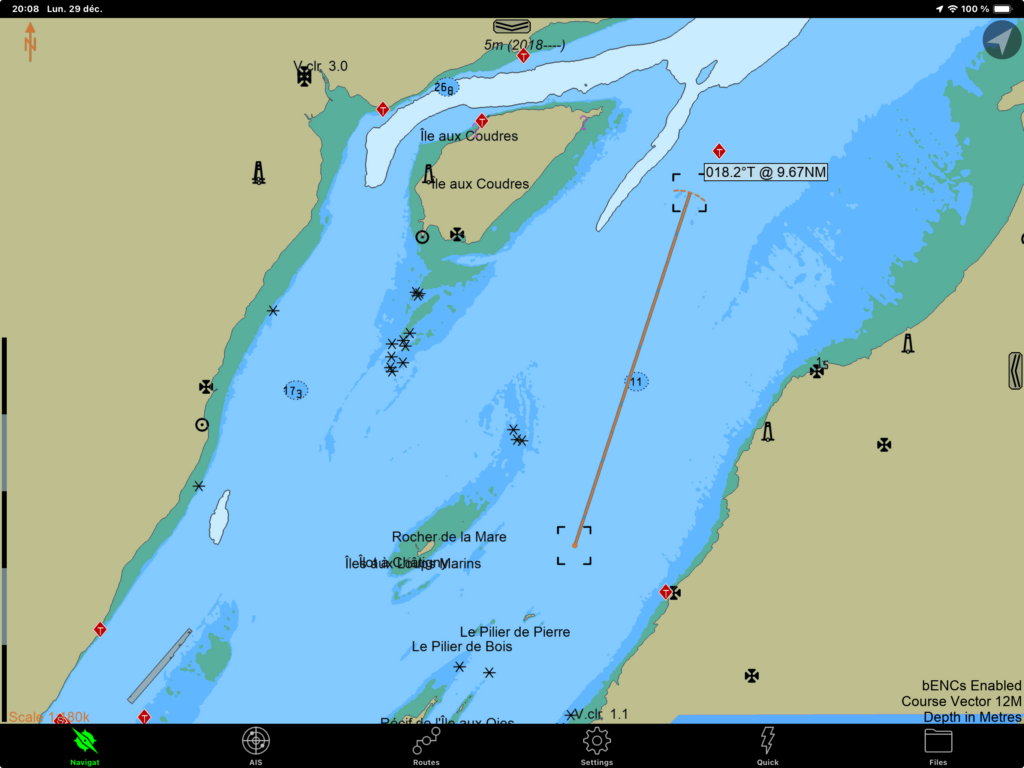
Simply double-tap on any starting point on the map. The context menu appears and you need to select the add tool sub-menu. Select the EBL tool and a line will appear on the screen. By moving the ends of the line with your finger, you can select the points of interest and the application will display the distance and associated heading. The image at the beginning of this section shows an EBL. The two images below illustrate the steps involved in creating an EBL.
You can create as many EBLs as you need. To delete them, double-tap on the EBL. A pop-up menu with a bin icon will appear and simply click on the bin to delete it.
The EBL tool is designed to take position readings using radar (and you need to be familiar with radar to know how to use it). That said, for planning purposes, the EBL tool can quickly be used to calculate distances… and perhaps illustrates the need for a dedicated tool for rapid distance measurements.
Distances and angles can also be measured during the creation of a navigation route. This is shown in a later section of the text.
Find out about currents and tides
The SEAiq application is particularly well equipped to analyse currents and tides. Below, I detail three ways of obtaining tide information. The first method, somewhat classic, is very similar to that presented by the Federal Tides Application, the second uses the S-57 electronic charts already availlable to the public to display the water levels infered from one tidal station, and the third uses the new S-100 chart formats to display the tide level correctly at any point.
Tides: the ‘classic’ graphical method
The classic method involves asking the application to download the tide station data from the federal government, displaying the stations in the application, and then selecting a tide station of interest to obtain the tide data.
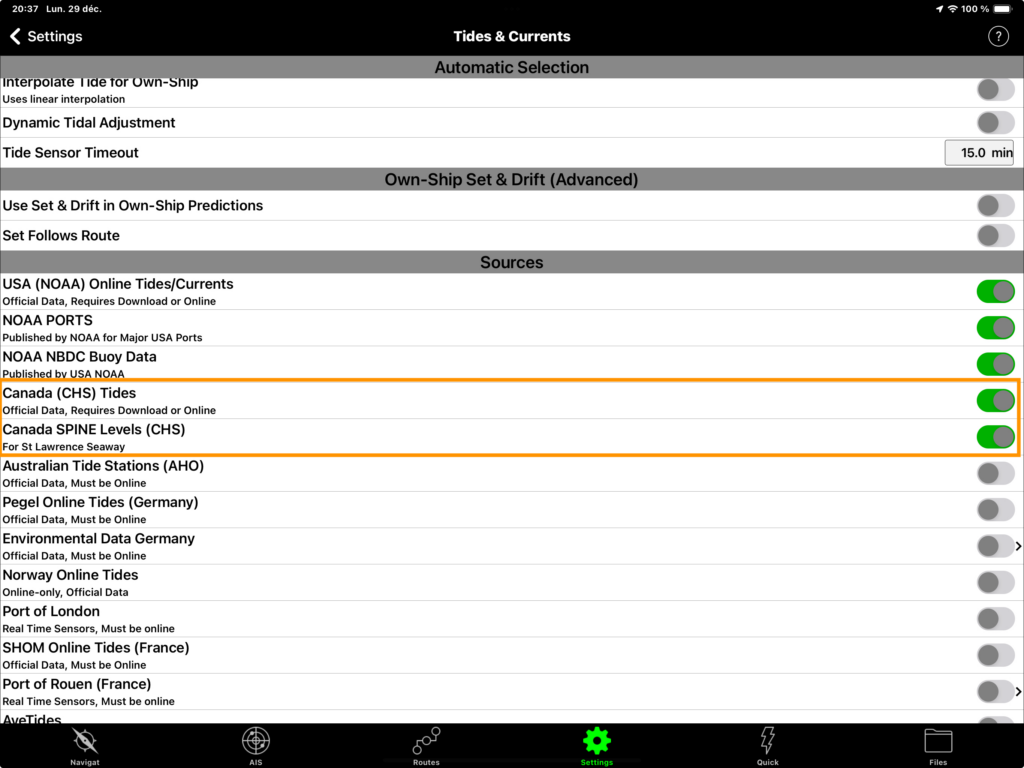
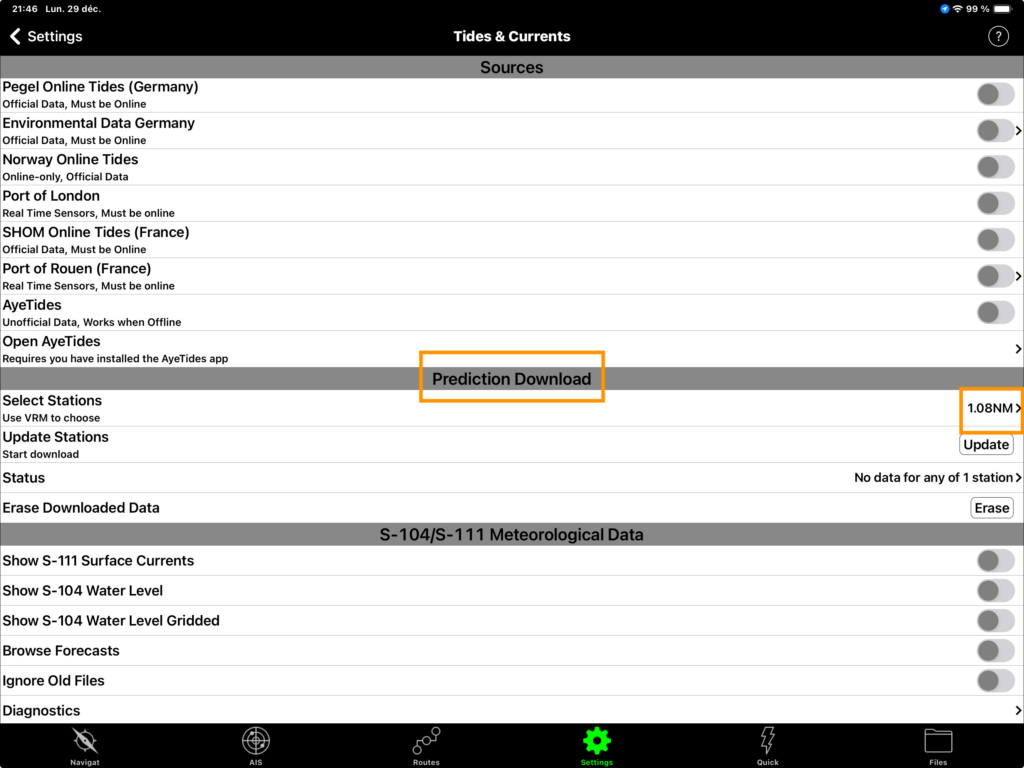
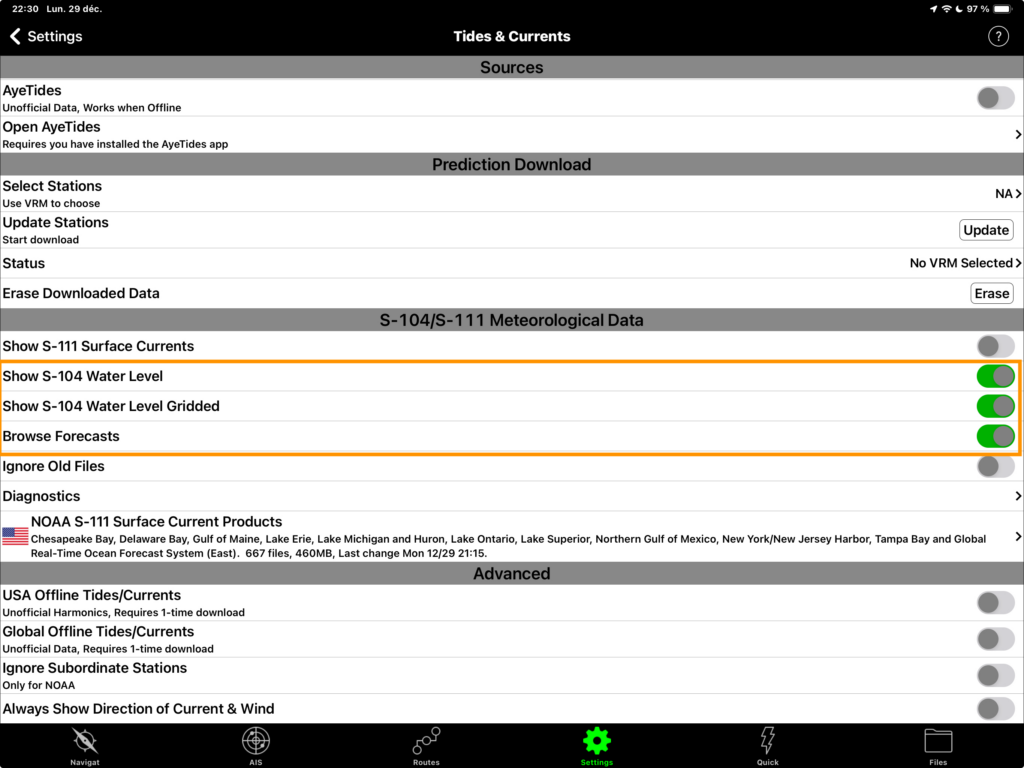
To download the data, go to the settings menu at the bottom of the screen. Then select the Tide & Currents menu. The two menus are framed in orange in the image below.
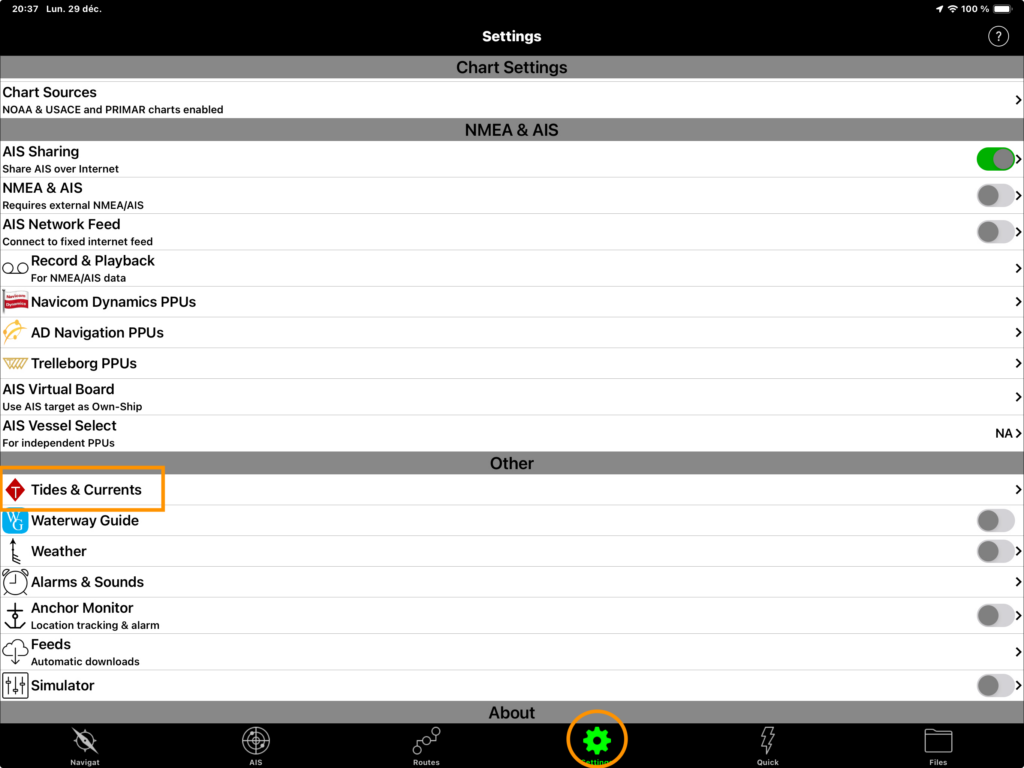
Once in this menu, you need to access the Canada (CHS) Tides and Canada SPINE Levels (CHS) options to access the Canadian water level stations. The menu, illustrated in the image below, shows that SEAiq can also download a large number of tide stations from several countries!
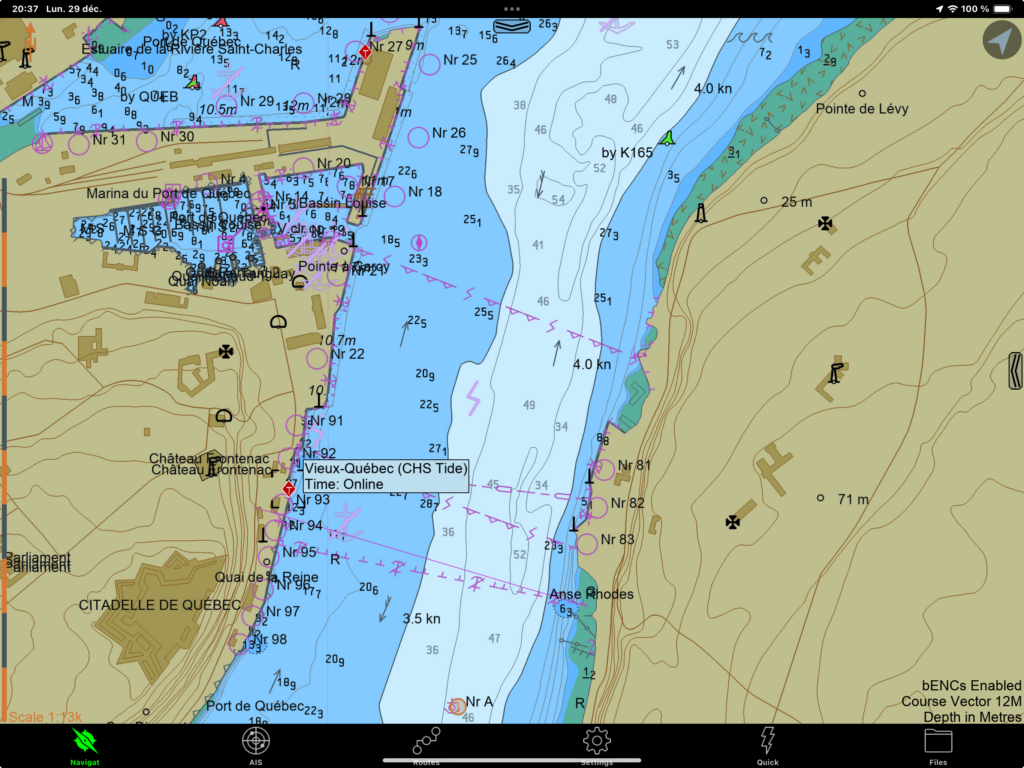
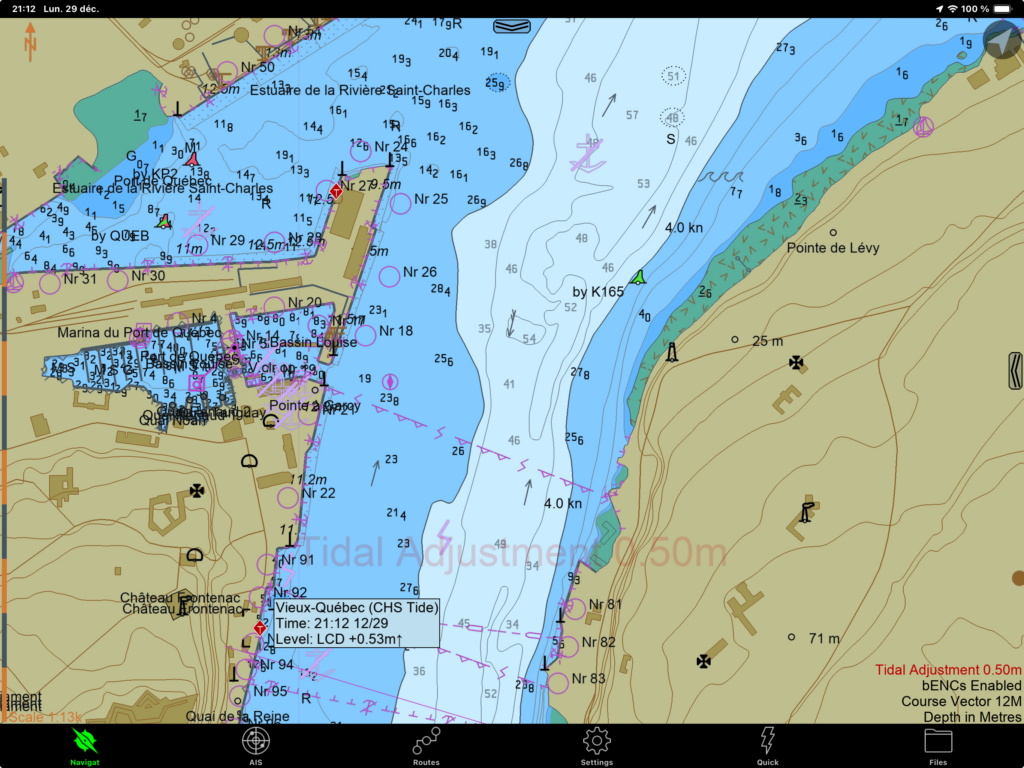
Once the data has been activated, the tide stations should appear on the charts as red diamonds with a ‘T’ (for Tide) inside. The image below shows the tide station in Old Quebec, near the Port of Quebec (and the Château Frontenac) and the one on the Rivière Saint-Charles (also in Quebec City).
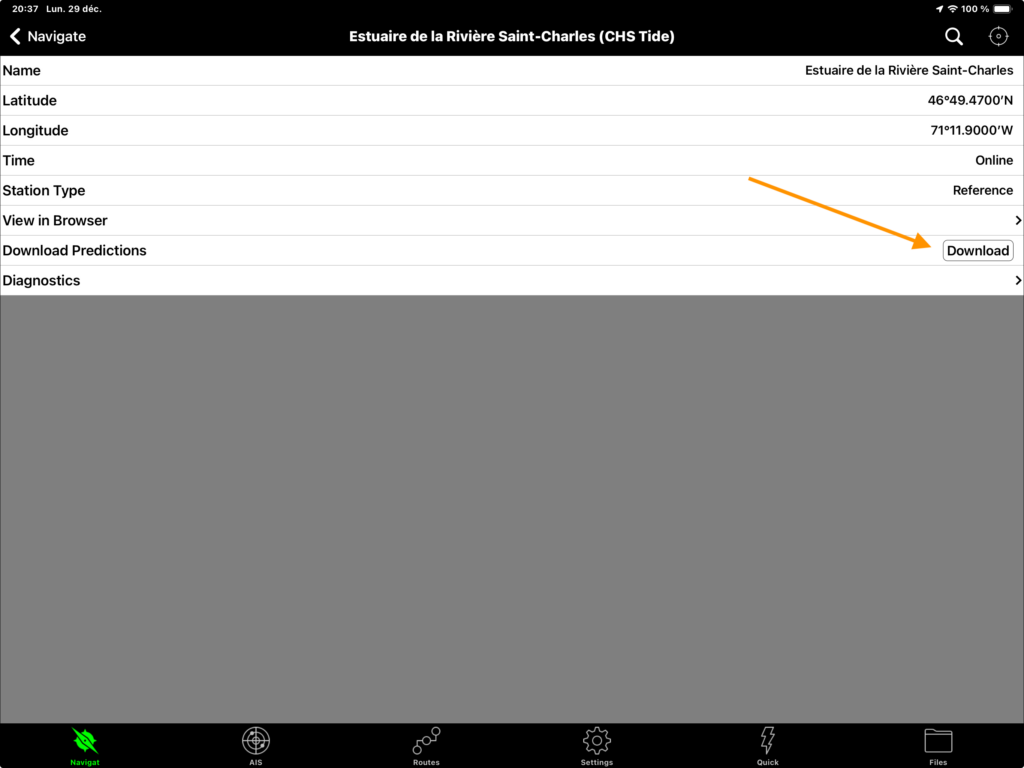
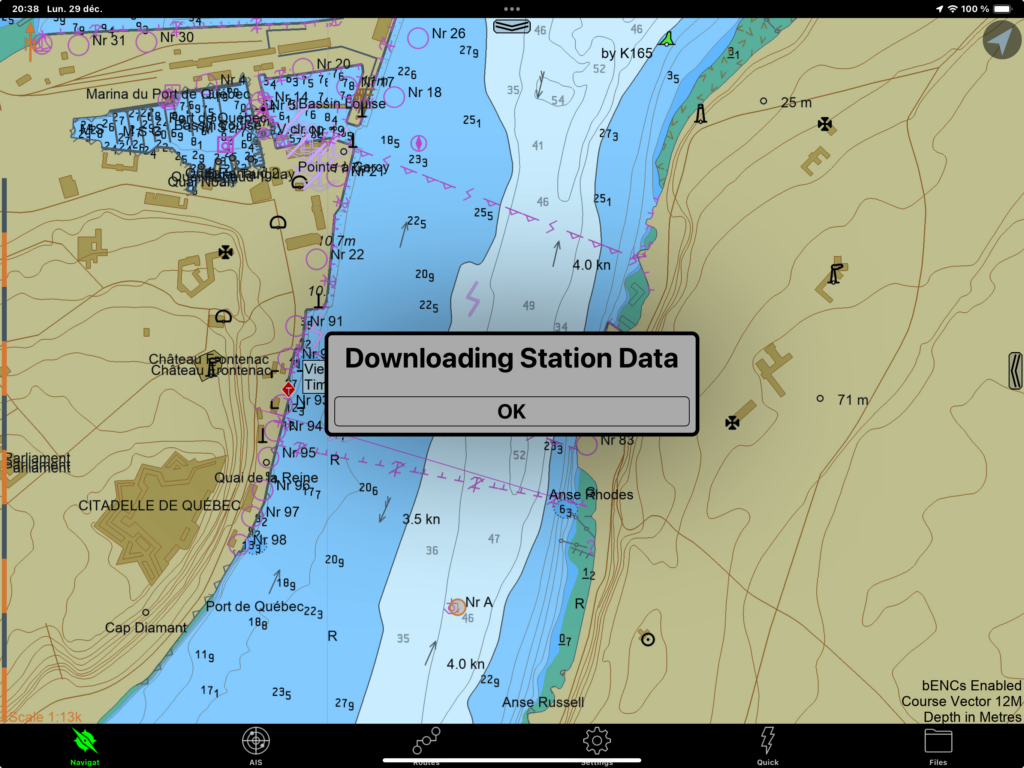
To access the tide data, double-tap on the tide station of interest and click on the Download button to download the data (image below). The application should then display a window indicating when the data has been downloaded (second image below).
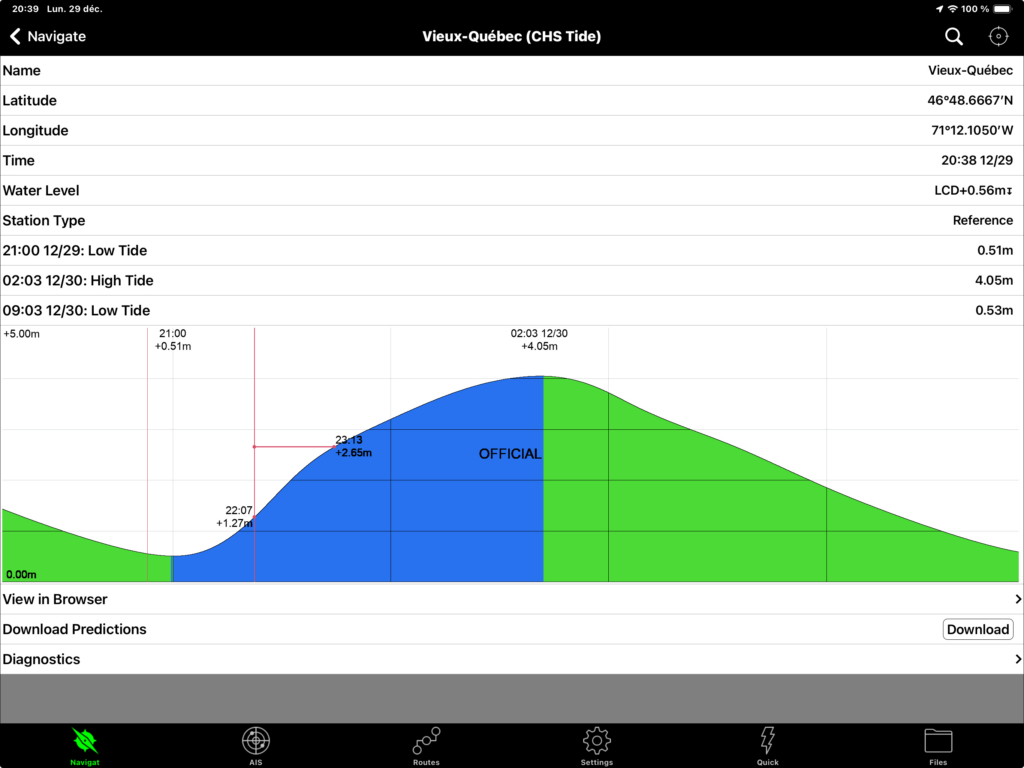
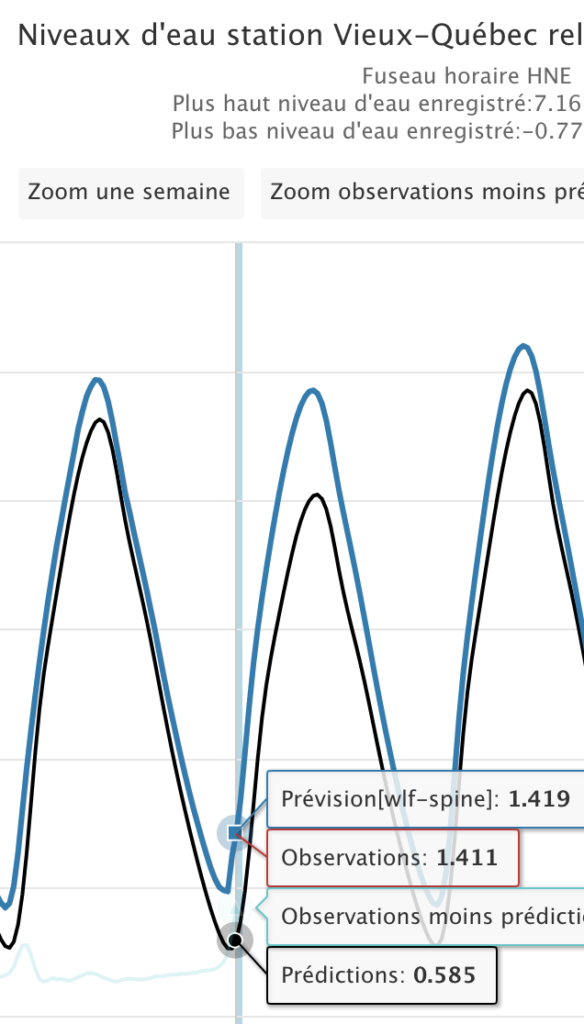
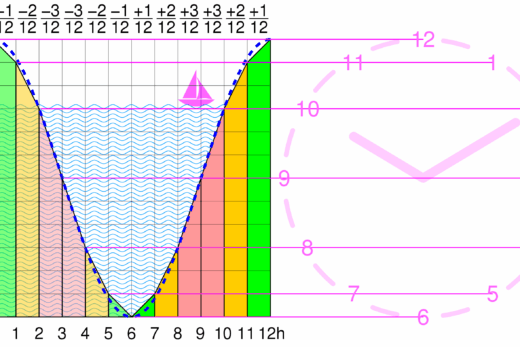
Once downloaded, the tide data can be accessed by double-tapping on the station. The application then displays the image of the tidal cycle as shown in the image at the beginning of this section. The image shows the tidal cycle incorporating the deviations from the sine curve that are specific to the Quebec City region.
In particular, by moving the cursor over a given point on the image, you select a water level and a given time. The application then simultaneously displays the water level that will prevail at the chosen time, as well as the time at which the chosen water level will occur. This contextual cursor is very useful for determining a tide window.
Tides: integrated method (on S-57 charts)
SEAiq can also be used to display water levels on navigation charts. The first approach is to select a tide station and then tell SEAiq to dynamically adapt the water level to that station. The advantage is that the water level displayed on the chart is the one that takes account of the tide.
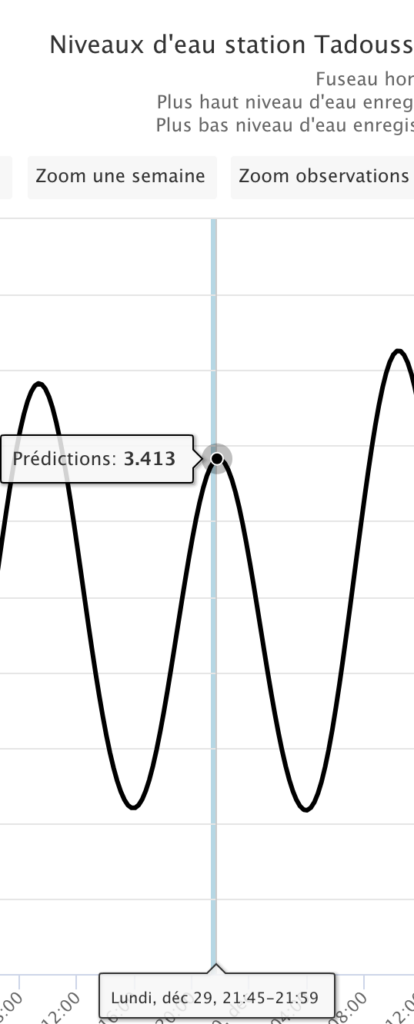
The drawback is that, by default, the station’s water level is projected in every points of the charts. If you choose the Old Quebec station, the water level at this station will be used, for example, to display the water levels in Tadoussac. However, some local knowledge should hint at the problem: when the tide is high in Quebec City, it is just about low in Tadoussac! This tide display mode is therefore ideal for local use, or when the chosen tide station automatically changes with the boat’s position. Otherwise, beware of erroneous information!
SEAiq warns with a red watermark that the water level is changing uniformly. As an example, the water level is corrected by 0.5m in the image at the beginning of this section, because at the time the screen shot was taken, the tide level at the station selected was 0.5m above chart datum.
To see the water level on the charts, you first need to select a tide station to use as a reference, then activate the dynamic display option of water levels. It must be done in this order. If you try to activate the dynamic display first, the software will complain that it doesn’t have a reference station from which water levels can be computed.
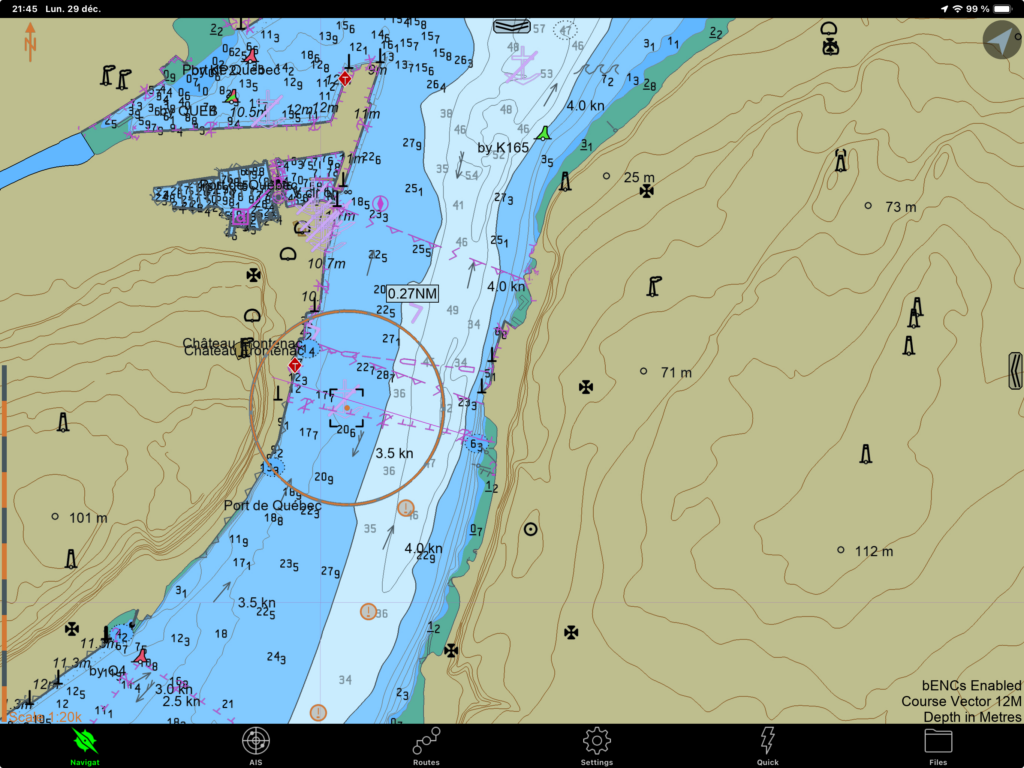
To choose a station, you need to build a Variable Range Marker (VRM) that includes at least one tide station. First, position the screen so that the desired tide station is visible. Then double-tap the screen to bring up the context menu. Choose Add Tool, then VRM to see a small circle appear on the map. You then need to modify the small circle to include the tide station of interest. The image below shows an example, encircling the Old Quebec tide station.
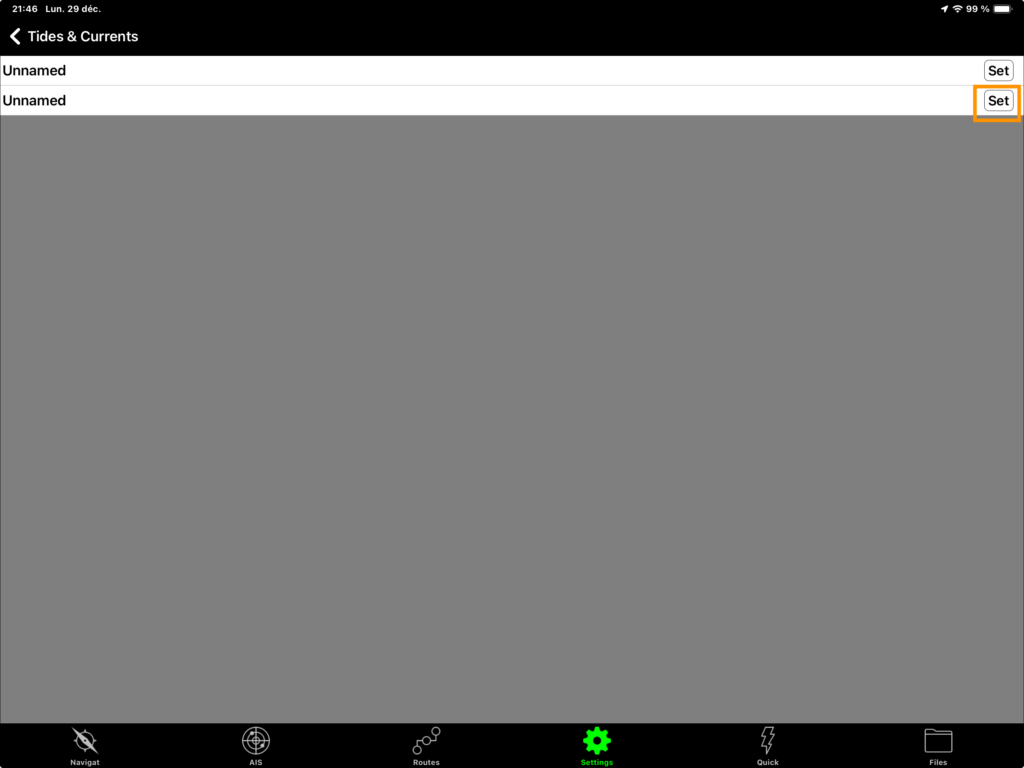
Once the station has been circled, go to the Settings menu, then Tides & Currents, and go to the Prediction Downloads section. Click on Select Stations, then choose the VRM containing the station of interest. If you have not given it a name, this VRM will be named unnamed , and the last in the list will be the most recent VRM.
The image below illustrates the prediction download menu. The station selection item is framed in orange (on the right of the screen). The next image shows how to select the VRM with a tide station.
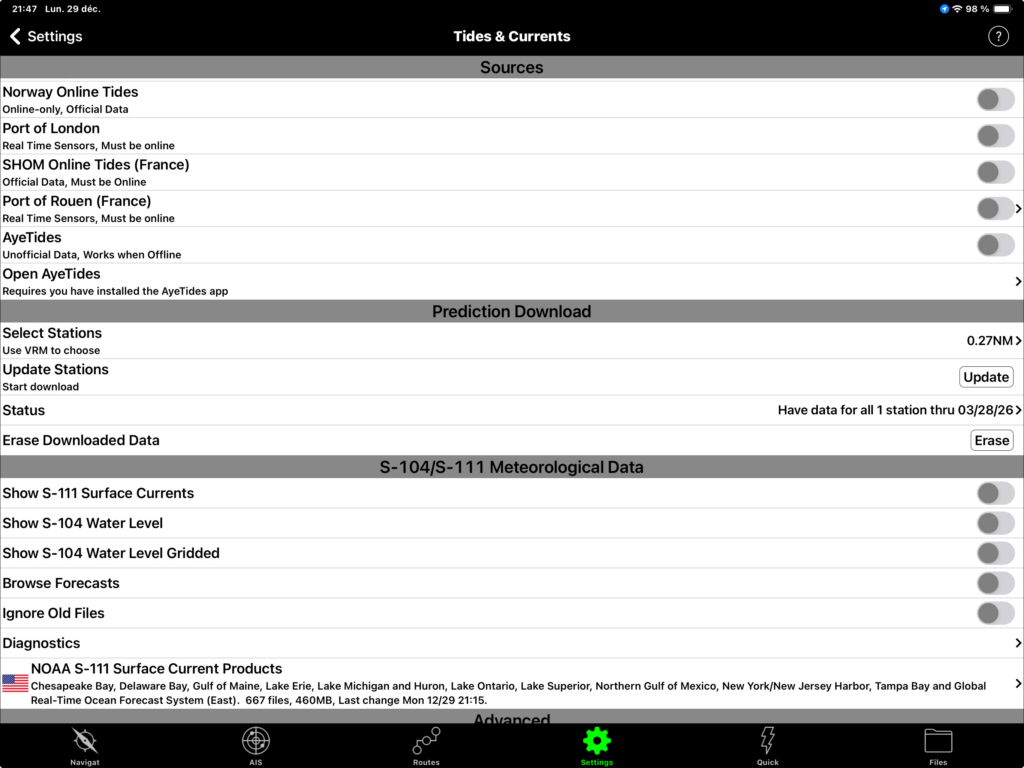
Once the station has been selected, download the tide station data from the Prediction Download menu by pressing the Update button. SEAiq will then download the data from the station for prediction purposes. It will download three months of predictions. Once downloaded, the Prediction Download menu should display that it has data. This is illustrated in the image below, which reads Have data for all 1 station thru 03-28-26.
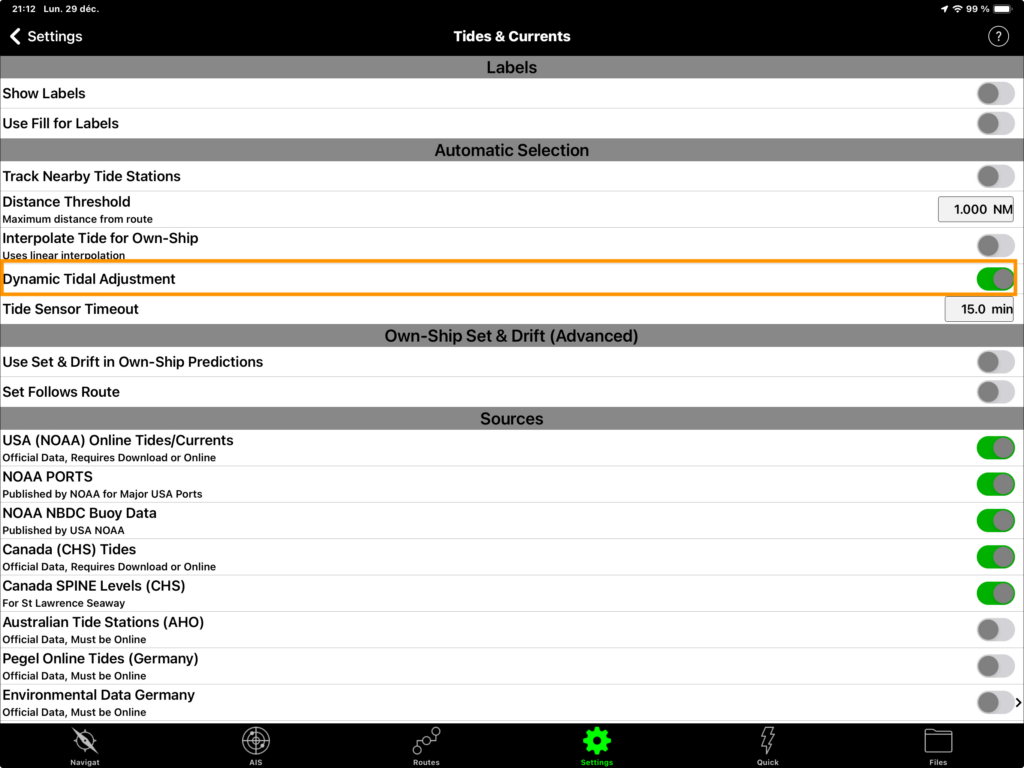
To activate the dynamic display, activate the Dynamic Tide Adjustments option in the Settings menu, then Tides & Currents. At this stage, the chart should display the water level taking into account the tide levels at the station (with a red watermark). The image at the beginning of this section shows an example of a dynamic tide display.
SEAiq can be made to change the tide station so that the one used for calculations is always the closest to the ship. This displays the water level best suited to the ship’s position. To do this, you need to draw a VRM that encompasses more than one tide station. SEAiq will then take the station in the VRM that is closest to the vessel’s position.
For route planning purposes, it is therefore necessary to construct a VRM that encompasses its entire route. As the vessel moves, the reference station will be adjusted. The water level at the station selected will nevertheless be projected everywhere on the chart, so even with this adjustment, care must be taken not to assess the water level too far from the boat.
Tides: integrated method (charts S-104)
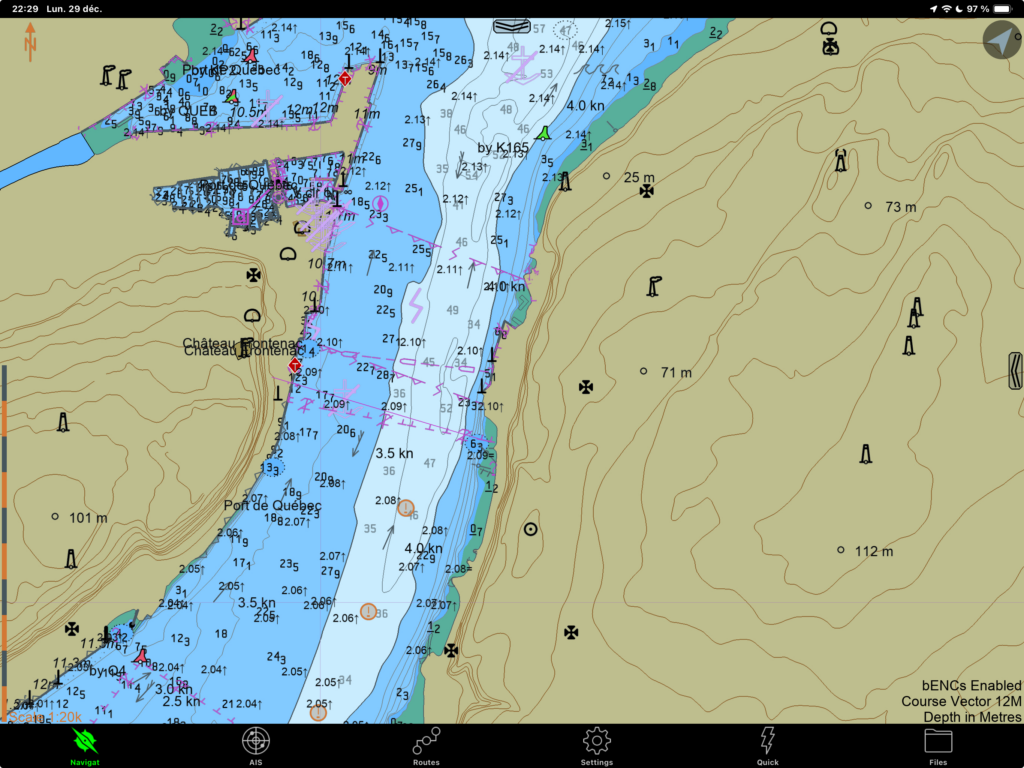
The previous technique works with the charts currently available, i.e. the S-57 charts. Of course, its drawback is that it projects the tide level of one station at any point on the charts.
The second technique presented in this section uses the new S-104 charts, which display the water level correctly at every point on the chart. It does not depend on a particular tide station, but on the tide data as a whole.
SEAiq’s programmers are still implementing the display of this new type of chart, so the graphical appearance presented in this text does not yet reflect a final product.
In the image above, you can see that the original depths (the chart datum) and the tidal heights (smaller numbers) are displayed alongside eachother. You have to add the two together to get the water level. Upon complete programming, we can assume that the application will display the sum of both. This will then give the best of both worlds: accurate levels in any point of the chart.
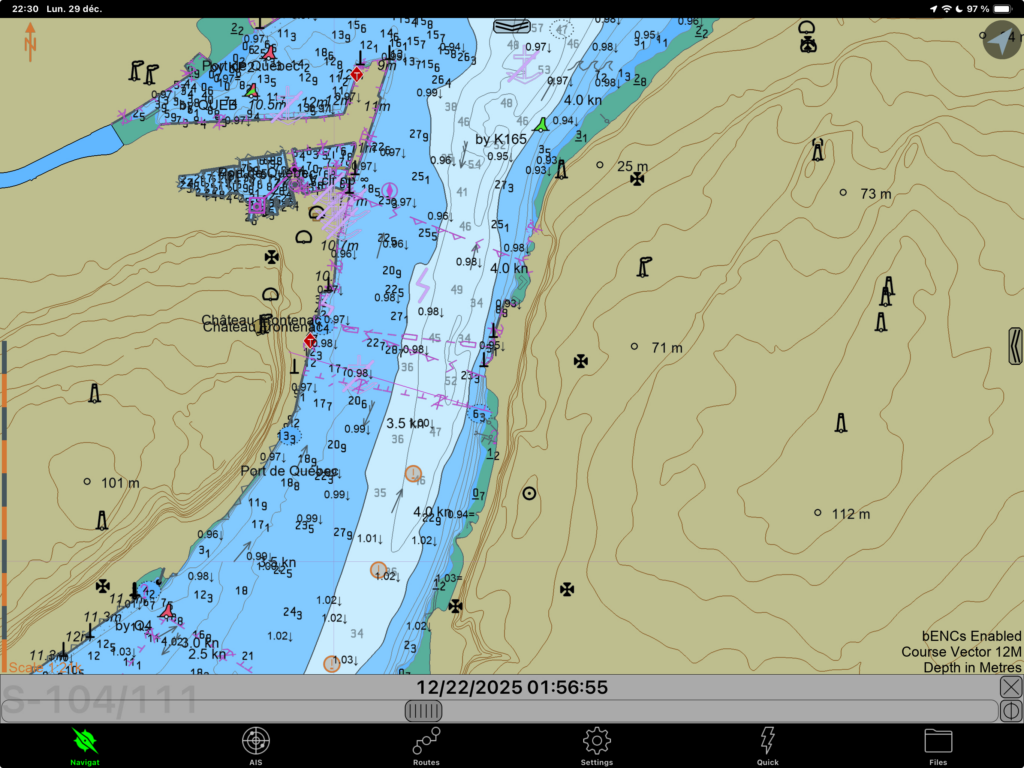
To activate the display of S-104 charts, go to the Settings menu, then Tides & Currents, then simultaneously activate the Show S-104 Water Level and Show S-104 Water Level Gridded options. Separately, the two options display nothing, which probably means that they are still being implemented. When both options are activated, you can see the water level displayed in real time, i.e. the image at the start of the section.
It is even possible to project the water level to a later date. If you activate the Browse Forecasts option, a pop-up bar with a slider will appear below the map. Moving the button moves the time of the water level prediction and the maps adjust to that time of the prediction. This is useful for planning ahead, but it is not possible to go very far into the future, limiting capabilities. The image below illustrates the prediction window with the sliding button.
Dynamic display of currents
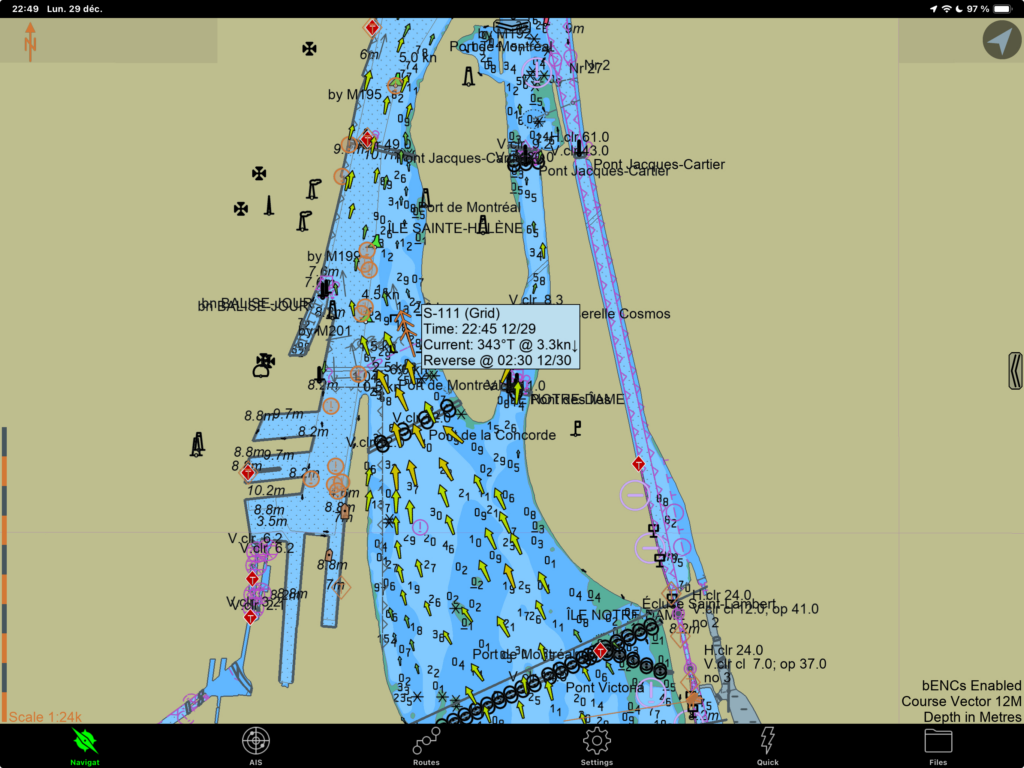
To display currents dynamically, you need to activate the S-111 chart display. Go to the Settings menu, then Tides & Currents, and activate the S-111 chart display option (the option is illustrated in the last image in the previous section). Returning to the navigation screen will then display the surface currents in real time.
The image above illustrates the currents as they arrive at the Old Port of Montreal (once over the Jacques Cartier Bridge). If you tap once on a region of the map, SEAiq will display the direction and intensity of the current.
An undeniable advantage of SEAiq is that it is the only application I have tested that provides accurate current data on the St-Lawrence. The data on the S-111 charts comes directly from the Government of Canada. They are the same data as those from the St Lawrence Global Observatory.
In a similar way to the S-104 maps, SEAiq also lets you project currents into the future to see how they will change. You need to activate the Browse forecasts option (see previous section). You can then move a cursor to see how currents will change in the near future.
For the moment, the application can only project currents and tides a few days ahead. It would be useful to access an interface for planning currents and tides for a later date beyond the horizon of a few days. Tides are calculated more than a year in advance, and for a given region, the current models only depend on the time relative to a particular point in the tide cycle. It is therefore possible to know the currents and tides at any point within a year. It is not clear to me whether this limitation on the projection of currents and tides comes from the application, or from the limited data transmitted via the S-104/111 chart formats.
Such a planning tool is particularly useful for sailboats, where current speeds and tide windows are crucial for planning passages. With a maximum speed of 7 knots on the water, being able to determine when currents are below (say) two knots is crucial for deciding when (and how) to cross the St-Lawrence seaway. In conjunction with the prevailing winds, being able to plan a passage window in advance is crucial for a vessel with limited speed.
Assessing speed and course over the ground
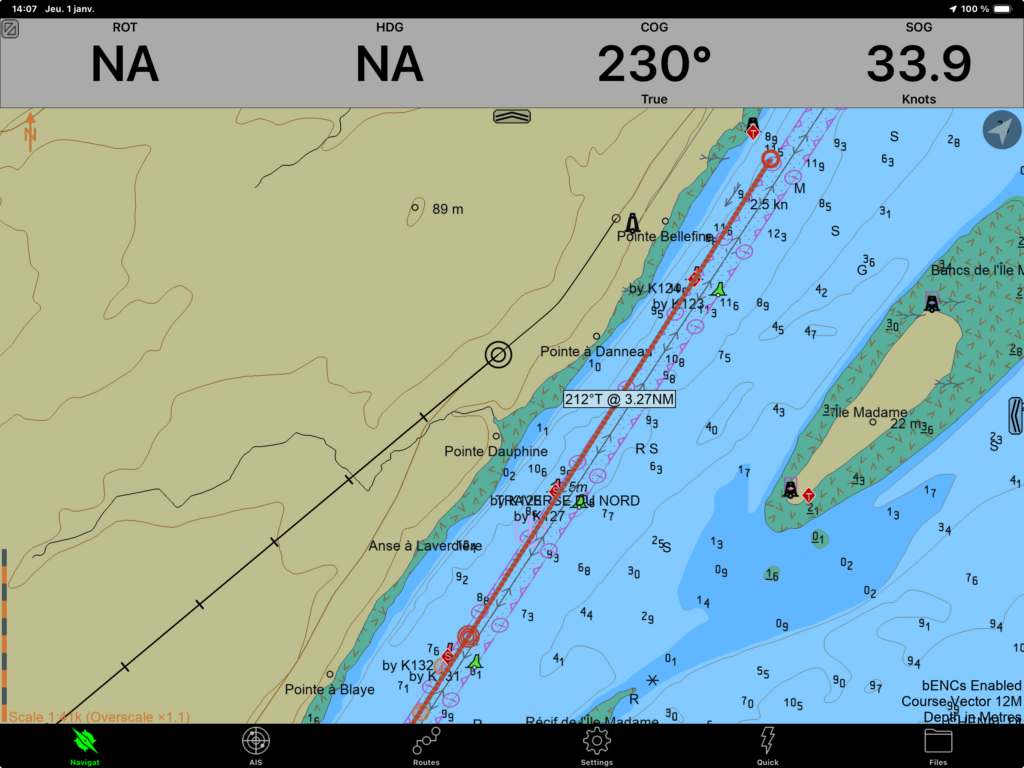
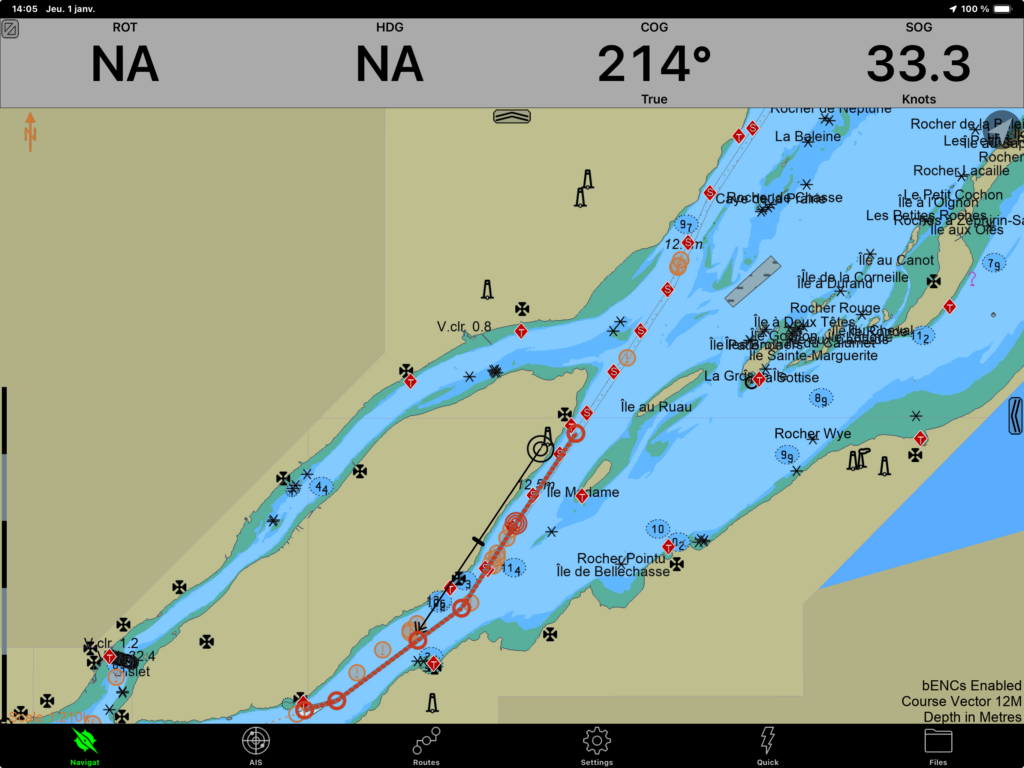
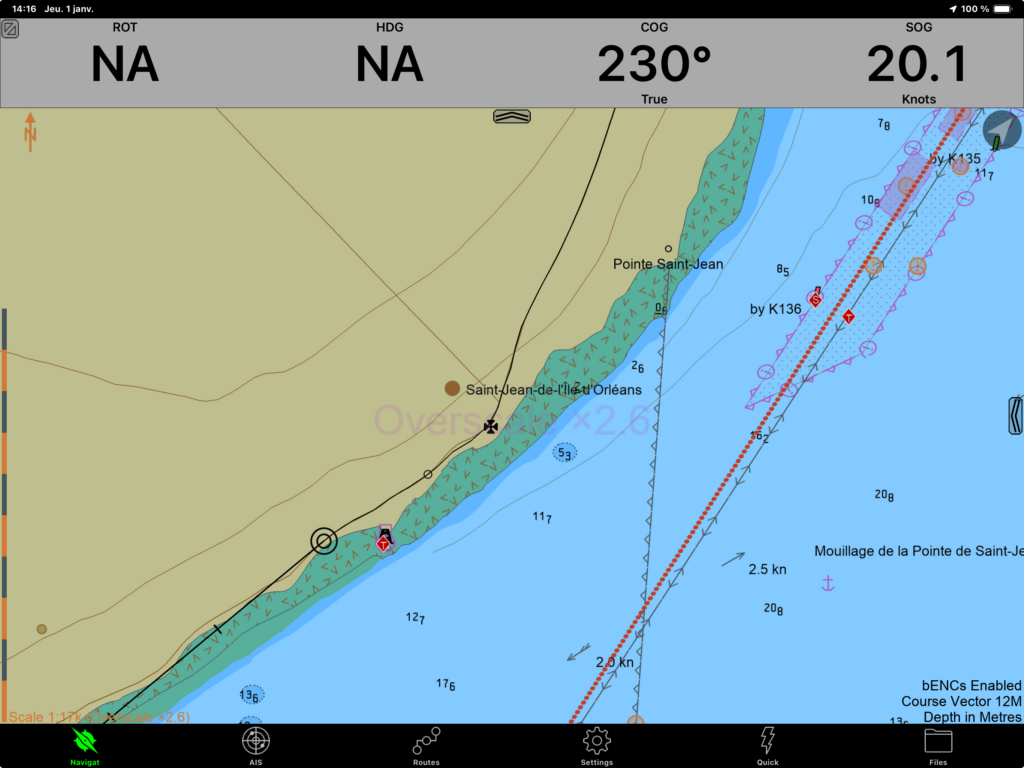
As soon as your tablet starts moving, SEAiq will calculate the speed and course over the ground from the GPS data. Press the slider at the top of the screen to display the navigation data (image above). The speed over ground (SOG) and course over ground (COG) are then displayed. Of course, rotational speed (ROT) and heading (HDG) are not displayed as they require a connection to the boat’s instruments (or a PPU).
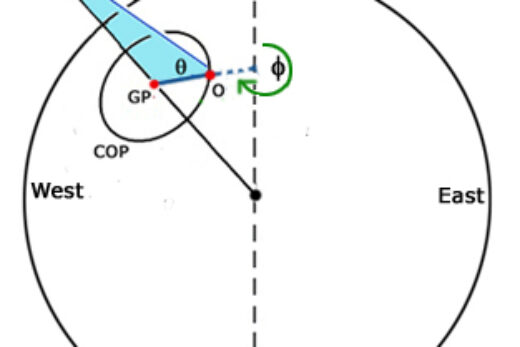
As soon as the tablet is in motion, SEAiq will also display the speed over ground vector on the screen. The ship’s position is represented by two concentric circles (image below) and the speed over ground vector by an arrow with two points. By default, SEAiq displays the speed over ground vector as a ten-minutes period. This means that if the vessel maintains its speed and course over the ground, its position in ten minutes will be the end of the arrow.
Planning and executing routes
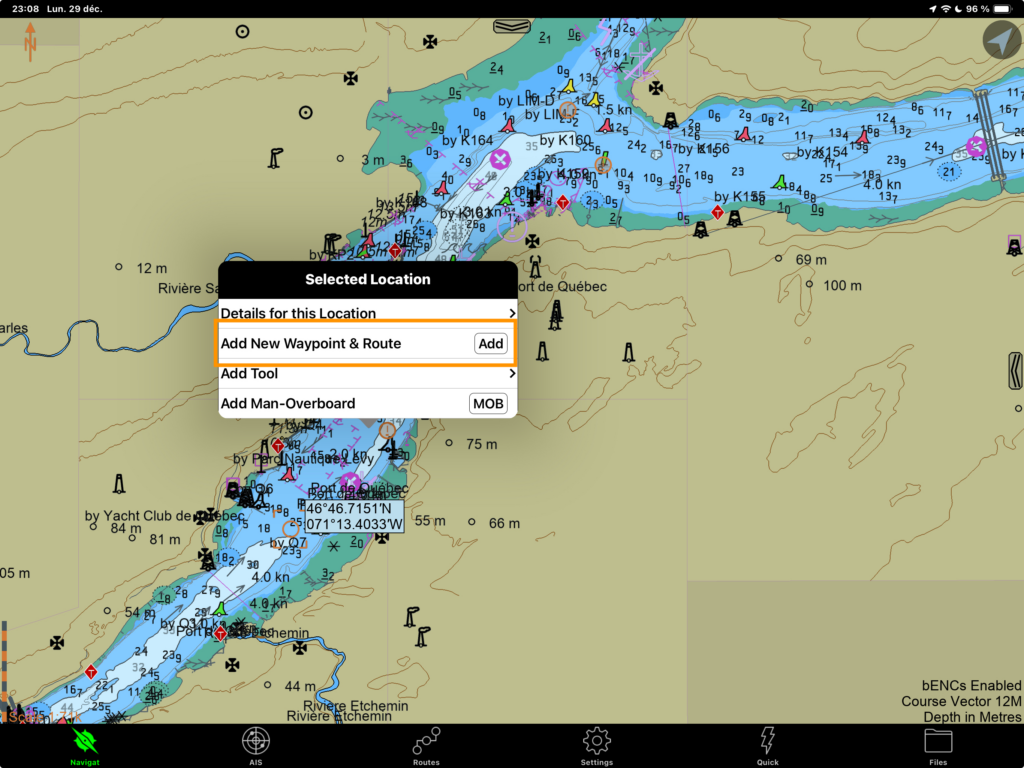
Routes are planned by successively adding waypoints to the map. Simply double-tap on any point on the map, then select the Add New Waypoint option to set the first waypoint of a route. For subsequent waypoints, repeat the operation, but choose the Add New Waypoint & Route option. SEAiq then understands that the waypoint created is added to the previous ones to create a route. The image below illustrates this second step.
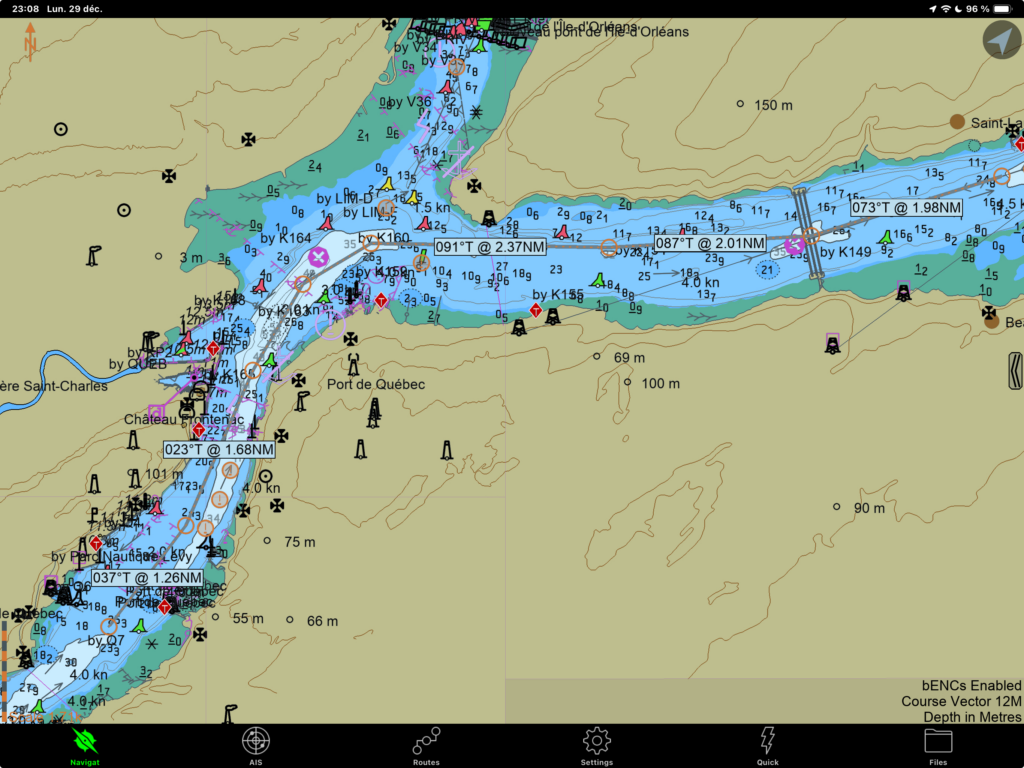
SEAiq does not need specific instructions to end a route. Unless another point is added, the last waypoint is assumed to be the end of the route. It’s worth noting that if you select the route by tapping on it, you can see the heading and distance of each rhumb line (see the image at the start of this section). This is another way of evaluating the distances and angles of a route segment.
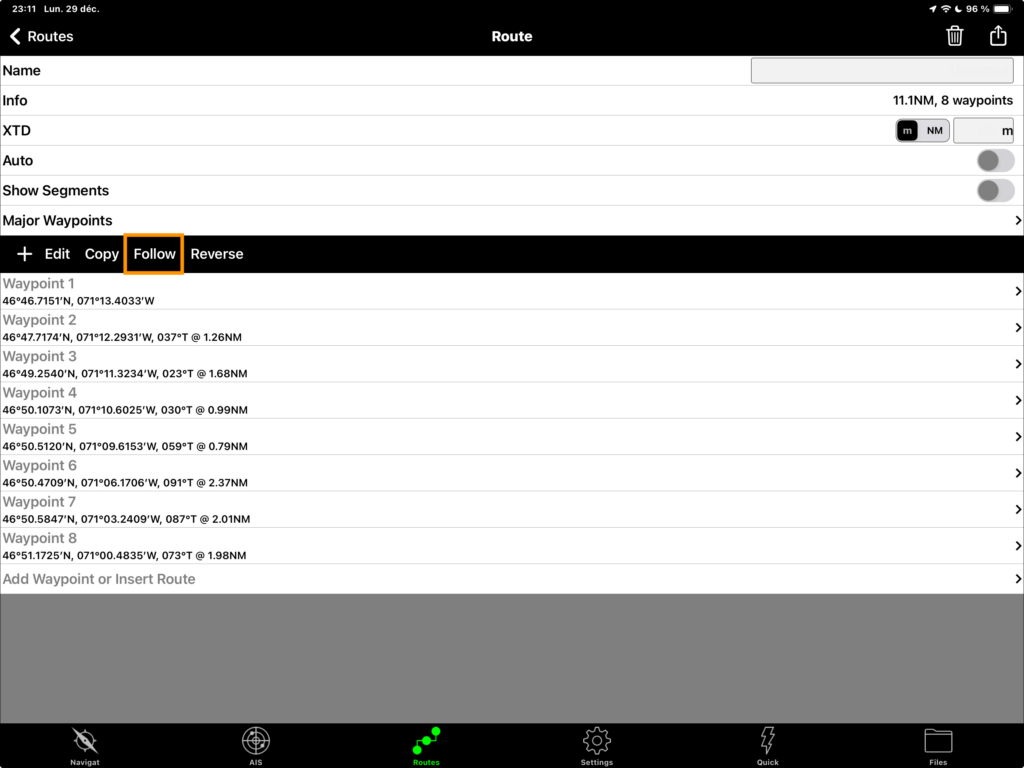
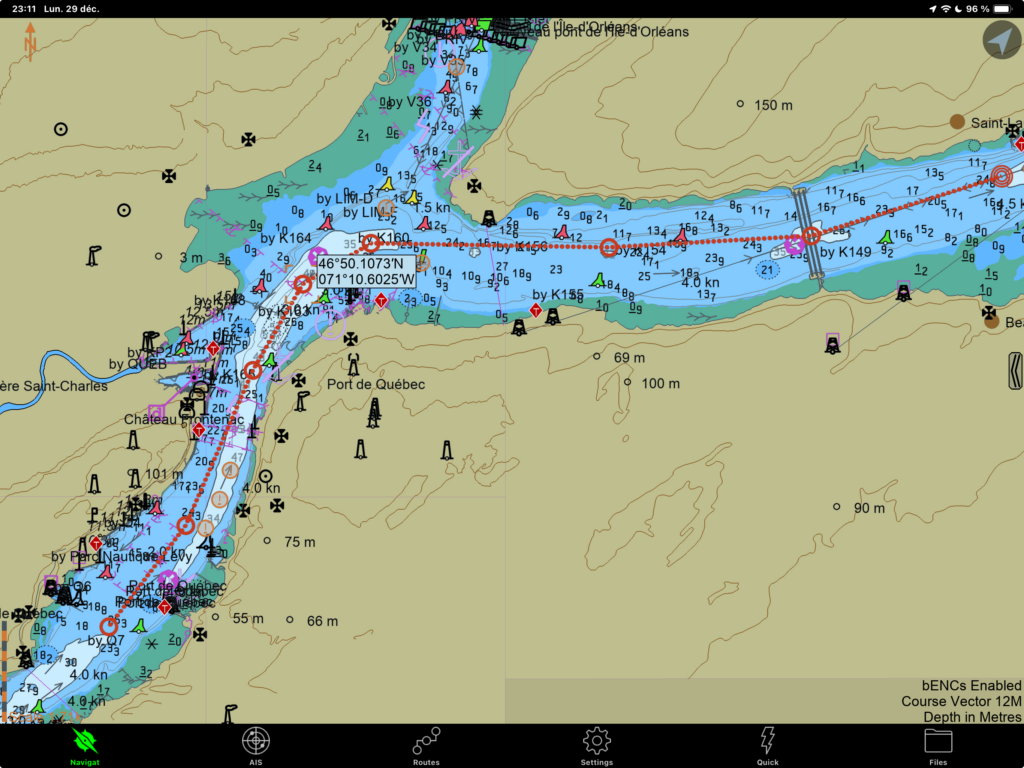
The route is activated via the Routes menu at the bottom of the application. All the routes are presented in a list, with the most recent at the bottom. Simply tap on this route, then click on the Follow button to activate the route. The application will then display the route and the closest waypoint. The two images below show the activation button and the activated route on the map.
Exchanging routes already planned
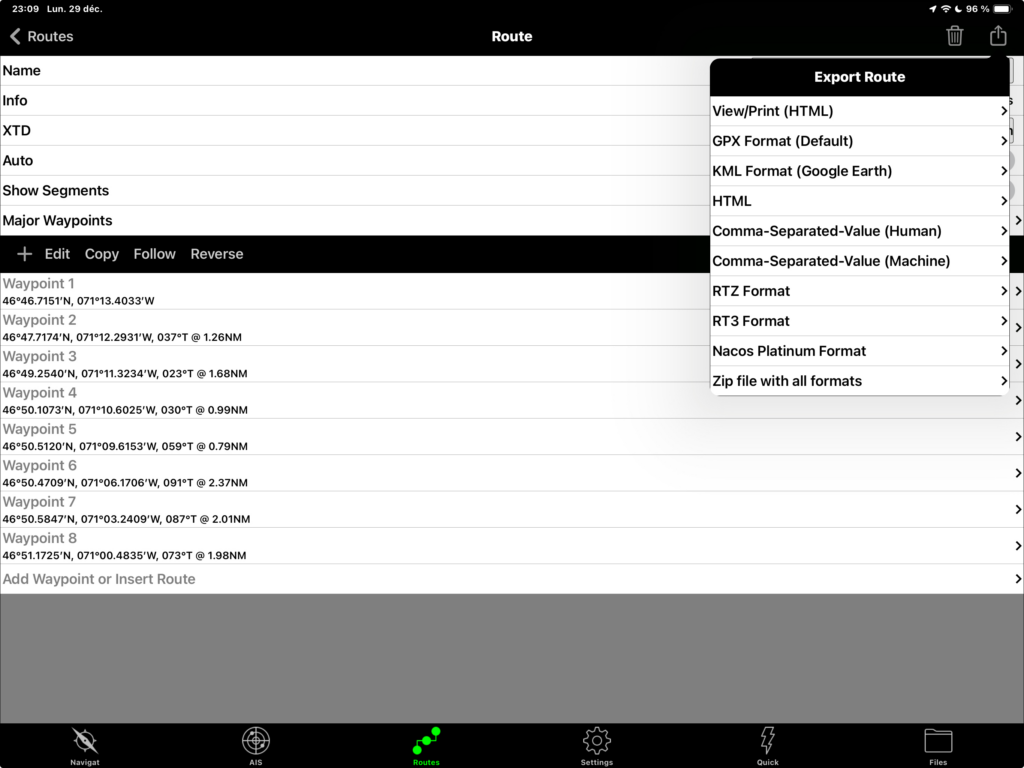
You can exchange previously planned routes via the Routes menu at the bottom of the screen. Select the route you wish to share, then tap on the share icon at the top right of the screen. The sharing options will then be displayed. SEAiq sets itself apart from other navigation applications by offering several sharing formats. The .gpx format, which is the most widely used, is offered. Other formats such as KML (Google Earth), html and CSV are also available. Once you’ve chosen a format, the operating system takes over, enabling you to share your route via an application of your choice (possibly your e-mail application).
Record the track
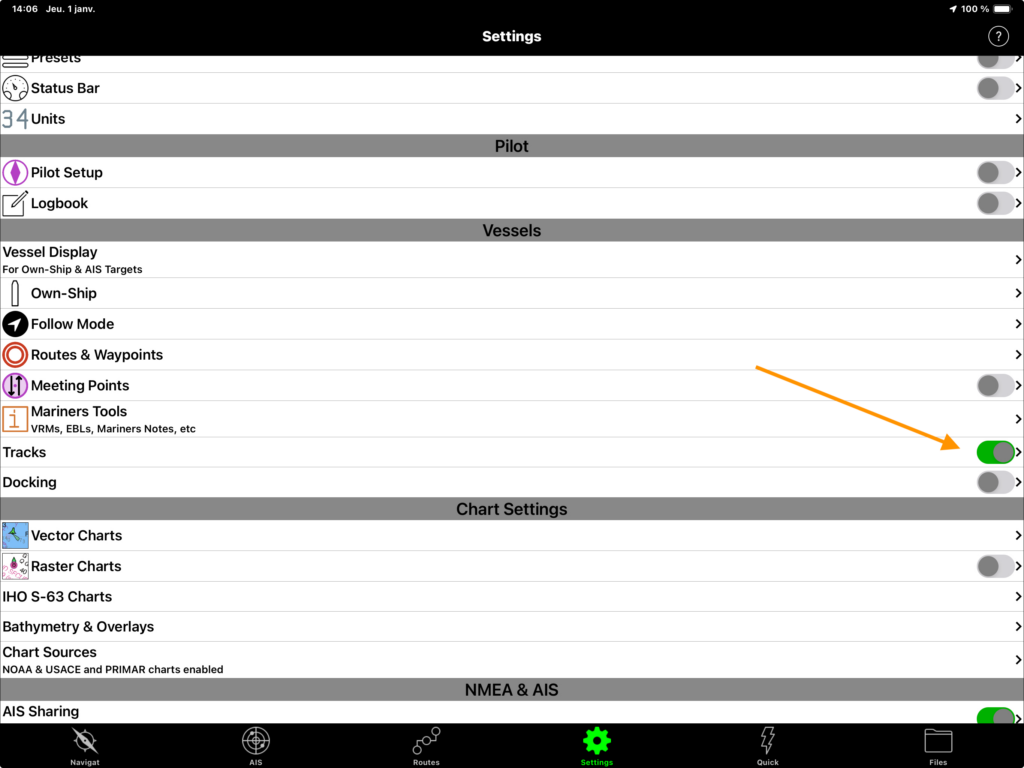
To record the track, go to the Settings menu, then the Tracks submenu and activate the option. At ten-minute intervals, SEAiq adds a small circle to the track, specifically recording the position and time. The image above shows the recording of a route in real time, following route 368. The recording was made while I was in a car. Following route 368 under sail is not advised (!).
The image below shows the track activation menu.
Bathymetry and navigation warnings
Bathymetry
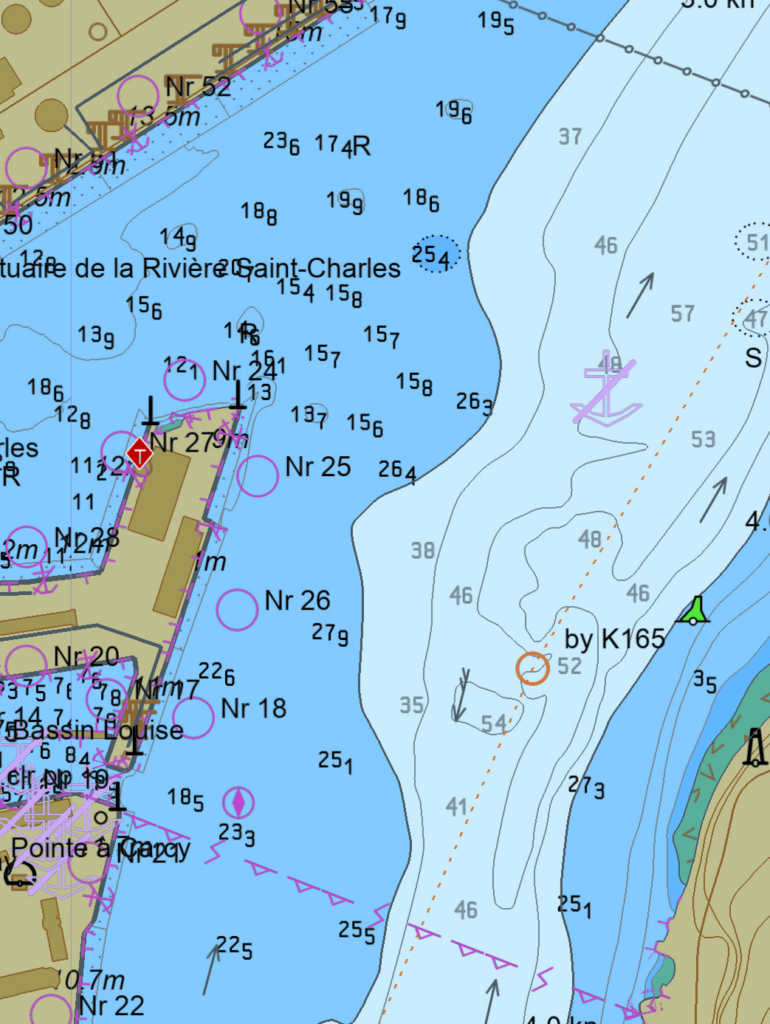
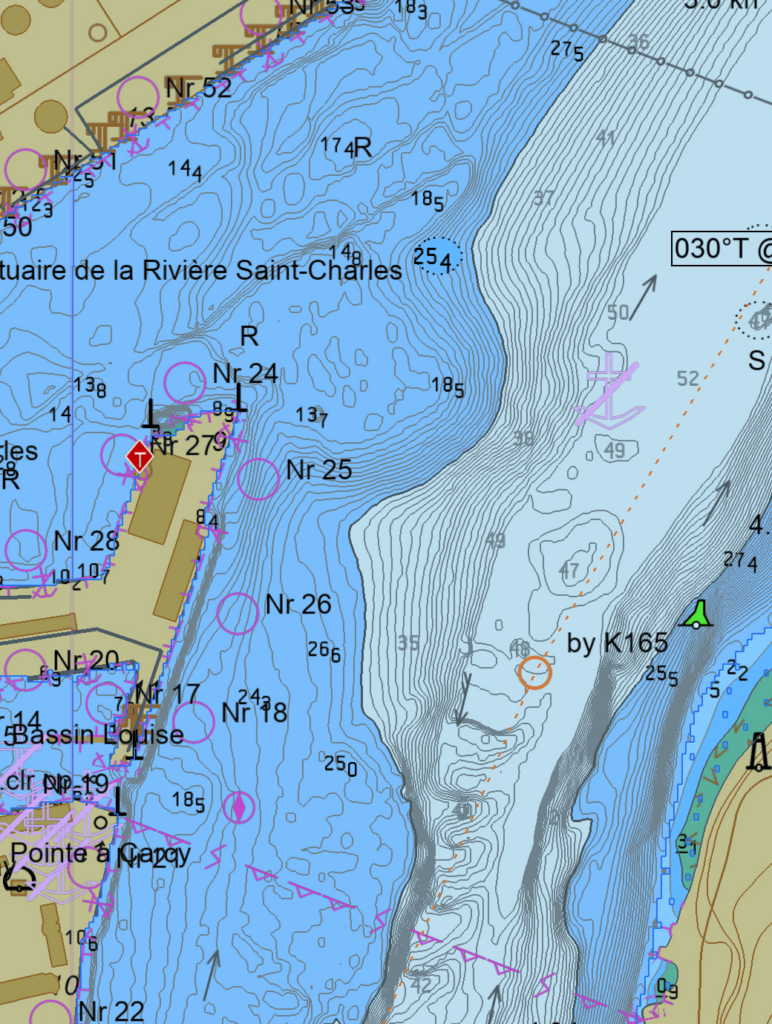
S-102 charts display the detailed bathymetry of a body of water. Instead of the usual maps showing depths to fixed isobathes (5, 10, 20 metres), the entire contours are shown.
A picture is worth a thousand words. The image on the left below shows the standard depth display formats, just in front of Louise Basin (Quebec). The image on the right shows the same body of water, with the S-102 chart format activated. The second display is much more precise… and requires much more computing power, and thus costs in battery life!
For large vessels, bathymetry information is crucial for determining under-keel clearance, which literally indicates whether a vessel has enough water under the keel to pass a given point. For small boats, detailed bathymetry close to shores can reveal interesting anchorages to spend the night. Of course, detailed bathymetry depends on the frequency and quality of the sounding work carried out. It’s a safe bet that shores, unlike commercial routes, are sampled less frequently.
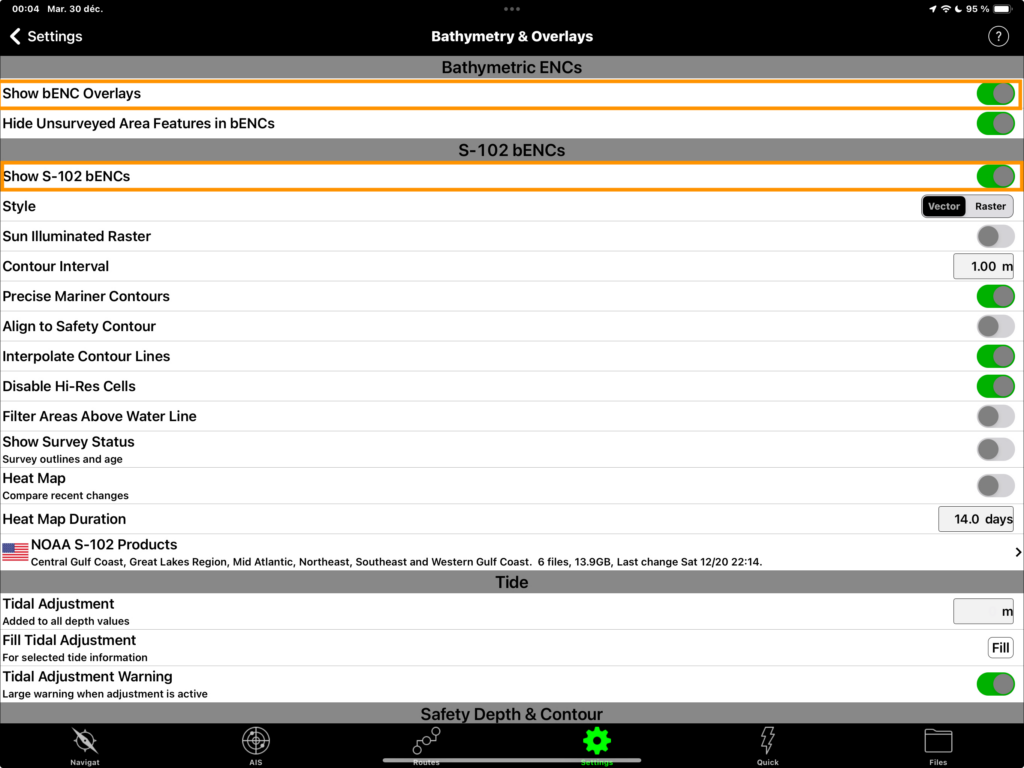
To activate the detailed bathymetry option in SEAiq, click on the Settings menu , then tap on the Bathymetry and Overlays item. In this menu, click on the Show bENC Overlaysand Show S-102 bENCs options. If the S-100 charts have been correctly downloaded when accessing the charts, then they should be accessible in the main application window (for US charts, they need to be downloaded separately from the NOAA S-102 products menu shown below).
In the image below, the two options to be activated are framed in orange. The subsequent options in the S-102 bENCs section are also worth exploring to refine the presentation of the charts.
Navigation warnings
Planning a safe passage requires systematic examination of the navigational warnings. You need to visit the Canadian Coast Guard website, sort the warnings by region and eventually target those that will impact your planned navigation. The old fashioned approach is to print these warnings, read them, and mark those related to the relevant chart areas. This work has to be done as frequently as the warnings are modified, or the routes modified. Wouldn’t it be practical to have this information automatically downloaded onto electronic charts?
SEAiq can integrate current navigational warnings and display them directly on the charts. To activate automatic downloading, go to the Settings menu, then to the Feeds menu. Activate the St Lawrence Seaway Notices/Shoals option, then press the Update button.

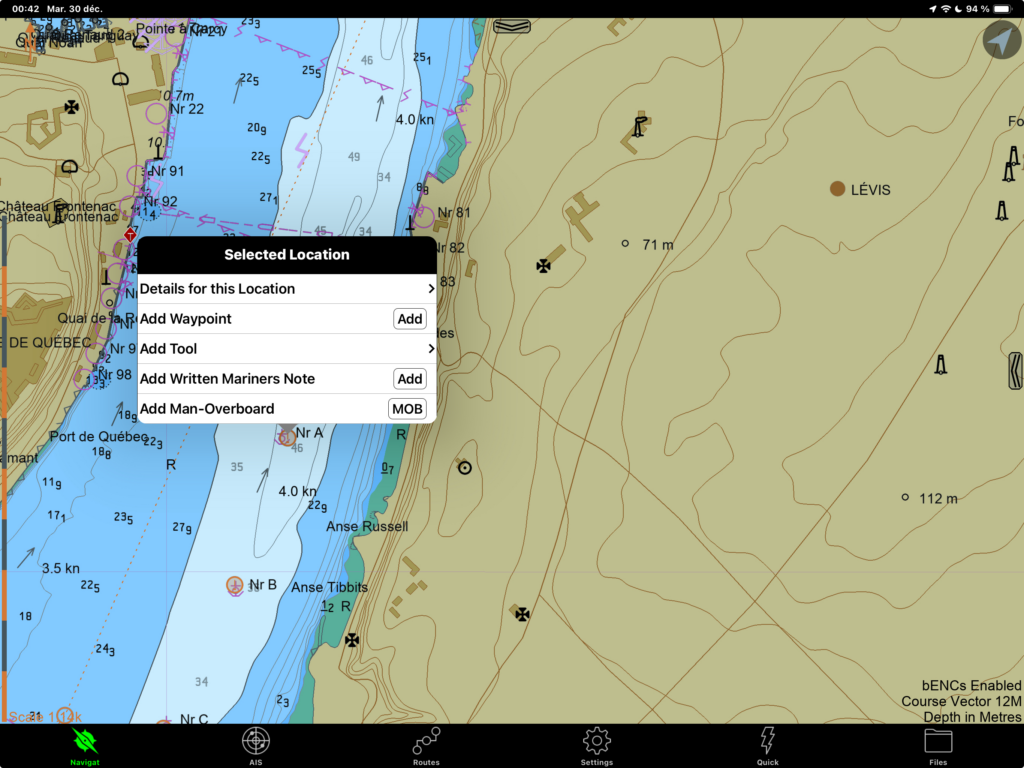
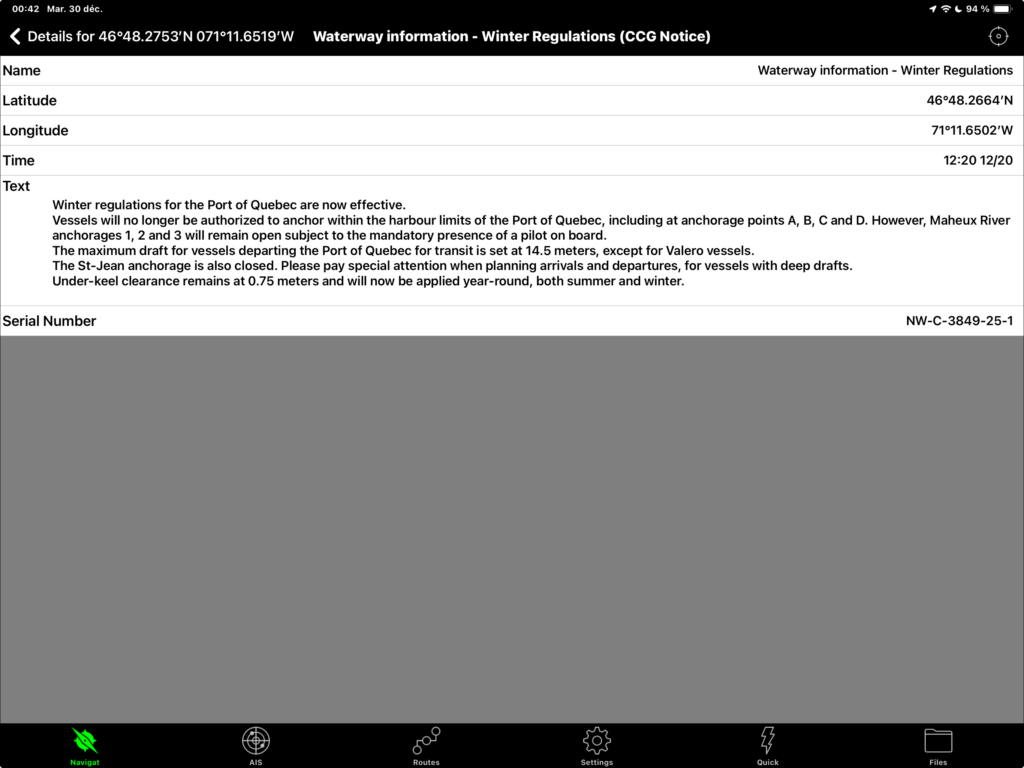
Once downloaded, they will appear on the chart in the form of small orange circles. Simply double-tap on them to bring up the pop-up menu, then choose Details for this location (image at the beginning of the section), then choose Waterway information […] CCG Notice (image below).
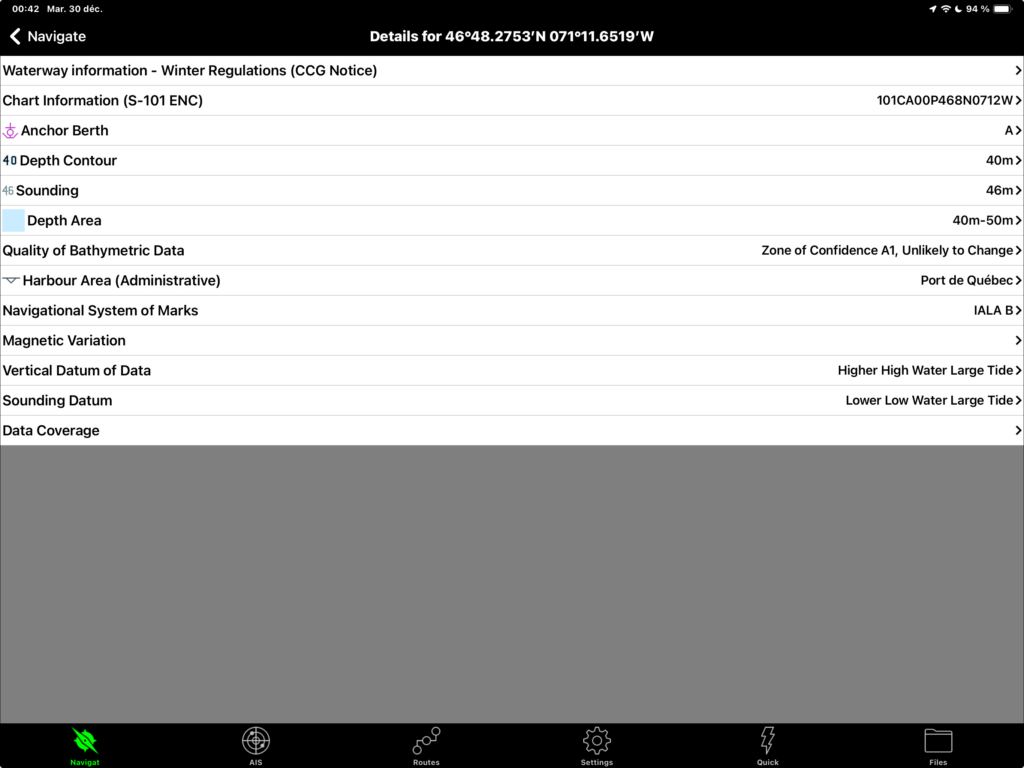
The application will then display the navigation warning specific to this area of the map. As shown in the image below, the warning concerns the restriction on anchoring in the Port of Quebec due to ice formation. Unfortunately for francophones, the information is only displayed in English.
Conclusion
This text examines how to perform eight essential navigation tasks with the SEAiq application. It also looks at the new S-100 format charts and illustrates the advantages of these new chart formats. I have mainly evaluated the software with these charts – which are still under development – so the display bugs discussed in the text will eventually be corrected. All in all, it is very promising.
This application will be able to replace electronic publications such as tide and current tables, sailing directions, the book of lights and buoys and navigation warnings. By integrating information into a single application, one can concentrate on the information required for navigation and automate updates.
This is the first time I’ve tested this application. I haven’t yet tested half of what it can do, and apart from the general impression that it’s a professional product that goes well beyond leisure applications, three preliminary thoughts come to mind.
The first is the overwhelming amount of configuration options. This reminds me of my early days with OpenCPN, where the sheer number of options was initially a distraction from use. The sheer number of options means that you can get lost in configuring the application. Which activation does what? The options should be simplified, and the initial configurations recommended for some types of navigation envisaged. For example, surface currents could be displayed by default for a sailboat profile.
The second is the lack of clarification as to the persistence of downloaded tide and current data. This application is clearly designed to be used with a working cellular connection, i.e. close to the coast. However, a few paragraphs in the manual should clarify how to plan passages with an intermittent cellular connection. What data should be downloaded in advance to ensure safe passage? When downloading data from a station, what is the time horizon of the downloaded data? What data remains in memory and what is lost?
The third is the display of real-time data. To obtain S-111 current data and S-104 tide data, an internet or cellular connection is required. Implicitly, SEAiq comes with an additional data cost that goes beyond the cost of using the application. For a boat on a budget, it is an overall pricy app!
In Canada, practical trials of the S-100 electronic charts have just finished (December 2025). The Canadian Hydrographic Service plans to deploy the S-100 charts in January 2026. Application providers will then be able to integrate these products into their software and, ultimately, users will be able to use them. Although deployed in the United States, S-100 charts are still a new navigation tool. Before relying on them in their entirety, preparing alternatives and adequately testing their reliability is a matter of ordinary seamanship. In the meantime SEAiq can pride itself in being first.
Did you like this text? It’s part of a complete series on electronic navigation apps. You can read them in the Learn section of this site.
Acknowledgements
The author would like to thank SEAiq for providing a free licence for the application. He would also like to thank the Canadian Hydrographic Service for providing access to the S-100 charts. The opinions expressed in this text do not necessarily reflect those of the Canadian Hydrographic Service nor of SEAiq.

4 Responses
[…] five introductions to different applications: Navionics (Boating), OpenCPN, C-MAP, Savvy Navvy and SEAiq. Below, I detail the elements common to navigation apps generally found on sailboats, yachts and in […]
[…] covers the Navionics (Boating) application. The other texts cover OpenCPN, Savyy Navy, C-MAP and SEAiq respectively. Prior to reading this text, it is a good idea to read the introduction to electronic […]
[…] on the C-MAP application. The other texts cover the use of OpenCPN, Savy Navy, Navionics and SEAiq. It focuses mainly on installations on tablets or cellular devices that are not connected to a […]
[…] other texts cover the Navionics (Boating), C-MAP, OpenCPN and SEAiq applications respectively. This text assumes that the application is installed on a device […]