This text is the first in a series of five on electronic navigation applications. It shows you how to perform the most important navigation tasks, i.e. how to:
- obtain electronic charts.
- read chart symbols.
- measure distances and angles.
- learn about currents and tides.
- evaluate speed and course over ground.
- plan and execute routes.
- exchange planned routes.
- record the actual route taken.
This first text covers the Navionics (Boating) application. The other texts cover OpenCPN, Savyy Navy, C-MAP and SEAiq respectively. Prior to reading this text, it is a good idea to read the introduction to electronic charts and the introduction to electronic navigation applications. Both will help understand this text.
Navionics (Boating)
Navionics is an application that displays professional nautical charts to boaters via a subscription system. The application is available on both the Apple store and the Google store, and works on the vast majority of modern electronic devices. Essentially, by paying a subscription fee for a given region of the world, Navionics provides charts that are continually updated (provided you are connected to the internet). There is a 90-day trial period during which data can be accessed free of charge, allowing you to evaluate the application. After that, you have to pay the subscription fee.
This is the application I use to execute my passage plans (and I work with another application for planning). The application is not without its faults, the most important being the handling of currents in the St. Lawrence. You may have different tastes than mine. This text may help you pick your favourite.
Purchasing electronic charts
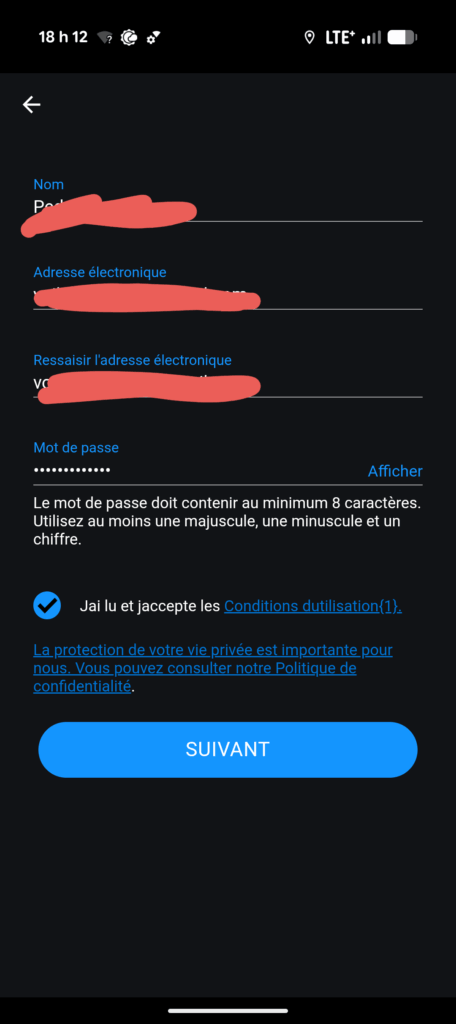
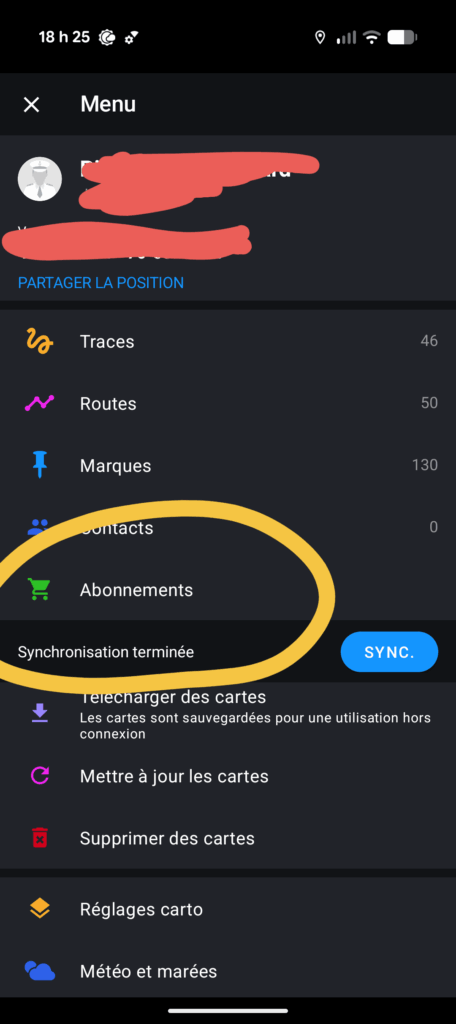
To obtain electronic charts from Navionics, you need to download the application, create an account and accept the user license. Go to the main menu, then select the “Subscriptions” section. You can then select the region of interest and provide your payment details.
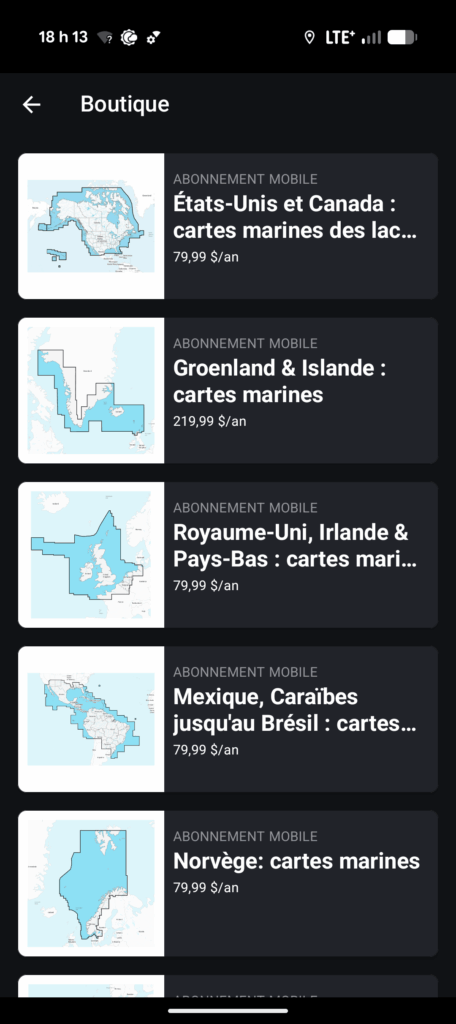
Navionics will then activate an automatic annual payment for chart use. In 2025, the subscription price for charts of the USA and Canada is 80 canadian dollars. If you want charts of the Caribbean, you’ll have to pay an additional subscription fee, and so on for each region of the world you’re interested in.
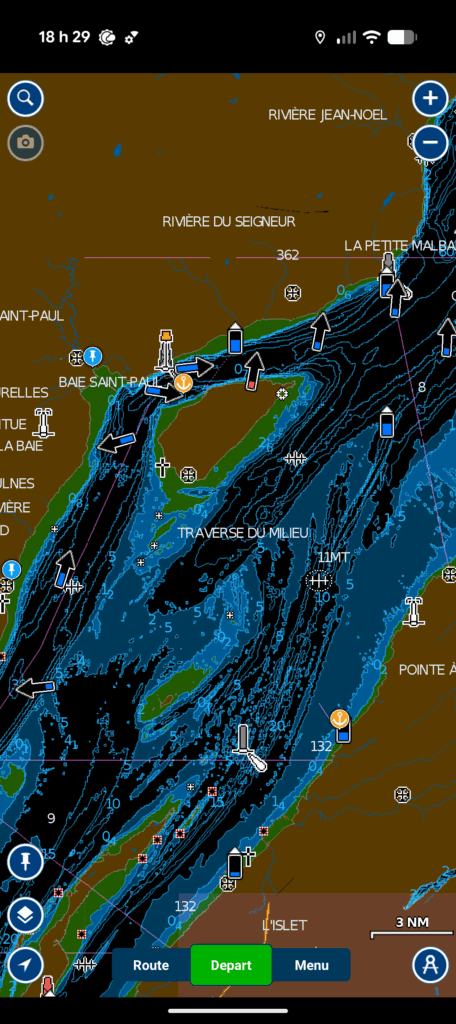
Once you have a subscription, you can pinch your fingers on the touch screen to target a navigation region of interest. As long as the device is connected to the Internet, the graphic objects making up this navigation region will be downloaded automatically by the application. A small blue download strip can then be seen at the top of the application.
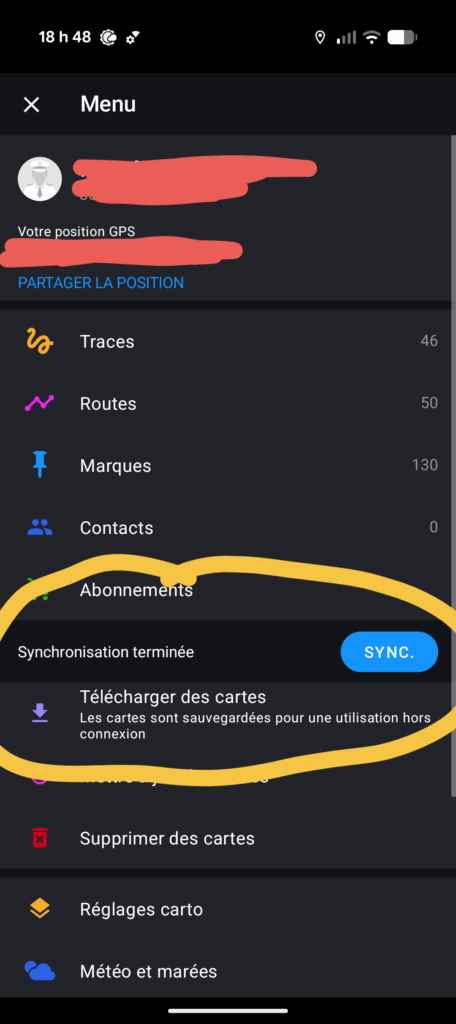
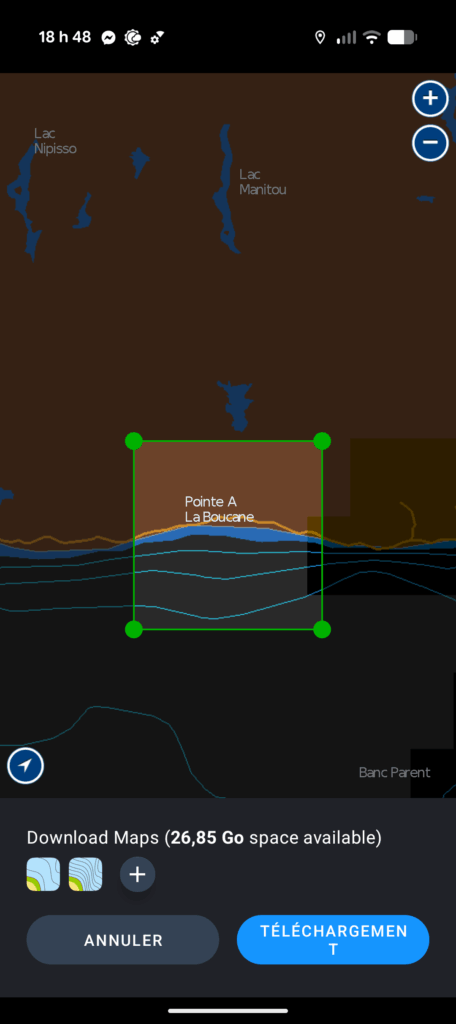
You can also download charts in advance. This option is particularly useful if you intend to navigate without an internet connection. Simply select the area of interest using the touchscreen, then download the chart. The selected area is then ready for use without an internet connection.
Reading symbols on the map
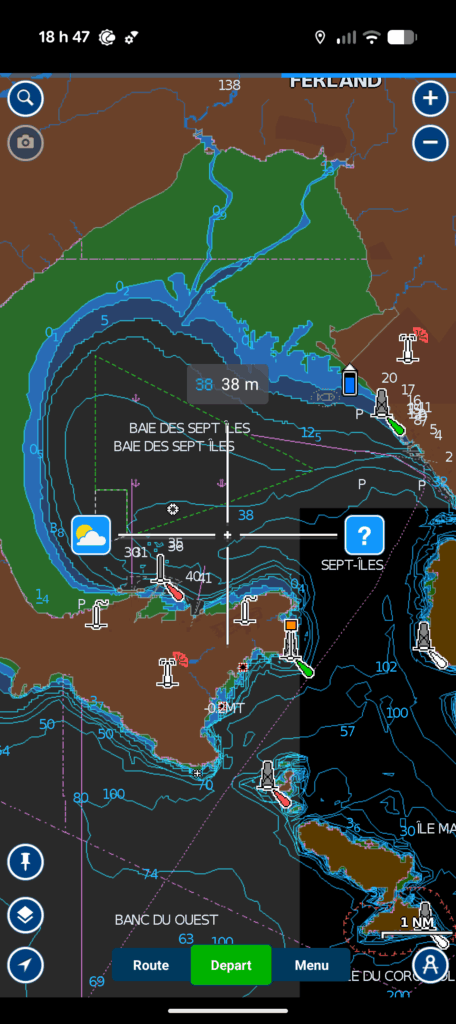
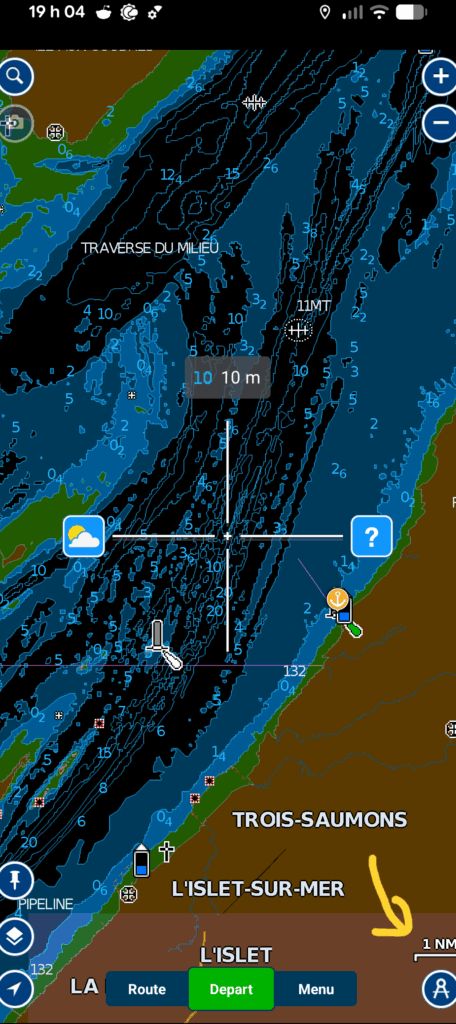
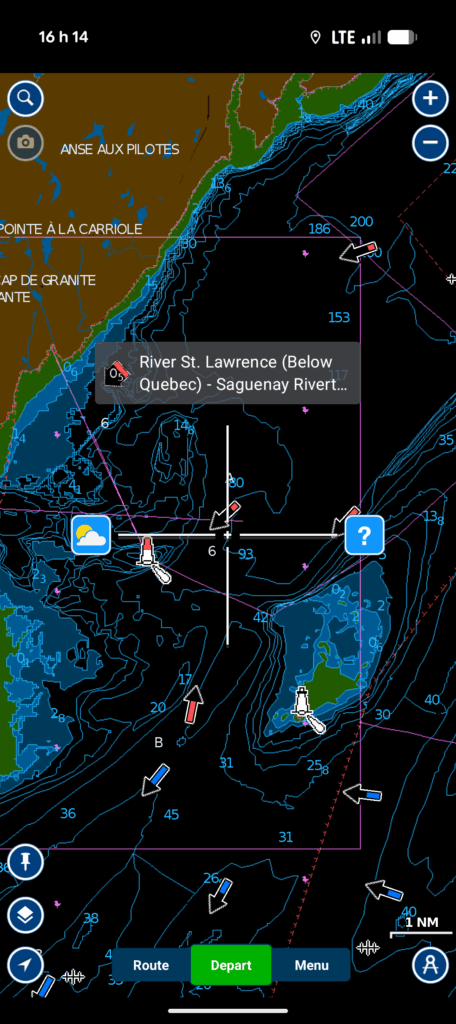
Navionics does not present all symbols in accordance with international conventions (recorded in Chart #1). It is therefore important to be able to interpret them. In this respect, the navigation crosshair – the cross in the center of the screen – is the essential tool for reading the meaning of symbols.
The crosshairs appear as soon as you move the map with a single finger. The center of the crosshairs is the target point for which information will be displayed. At the top of the crosshairs is a brief description of the target point. To the left of the crosshairs is the weather information menu (a cloud and sun icon). To the right is the detailed information menu (the question mark).
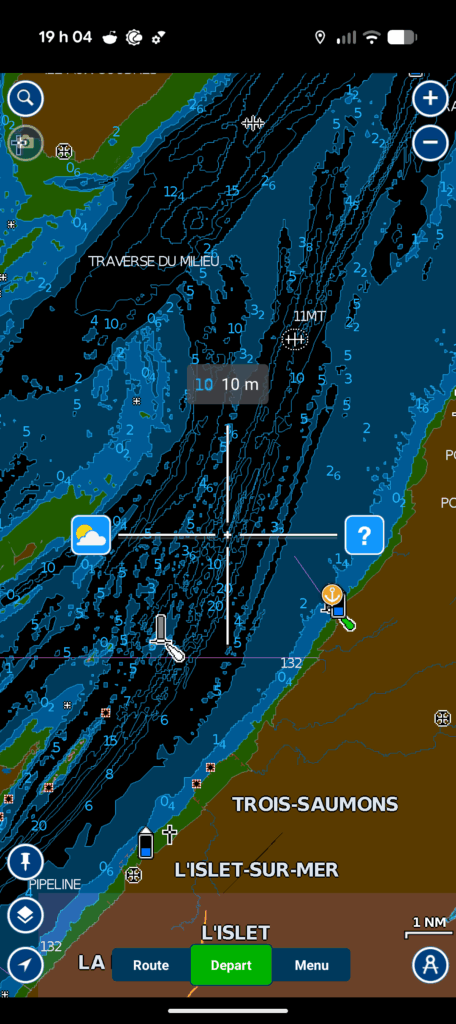
To obtain information on a particular symbol, move the chart so that the crosshairs are on the symbol. You can then obtain summary information at the top of the crosshair, but for detailed information, you need to click on the detailed information menu button (the question mark).
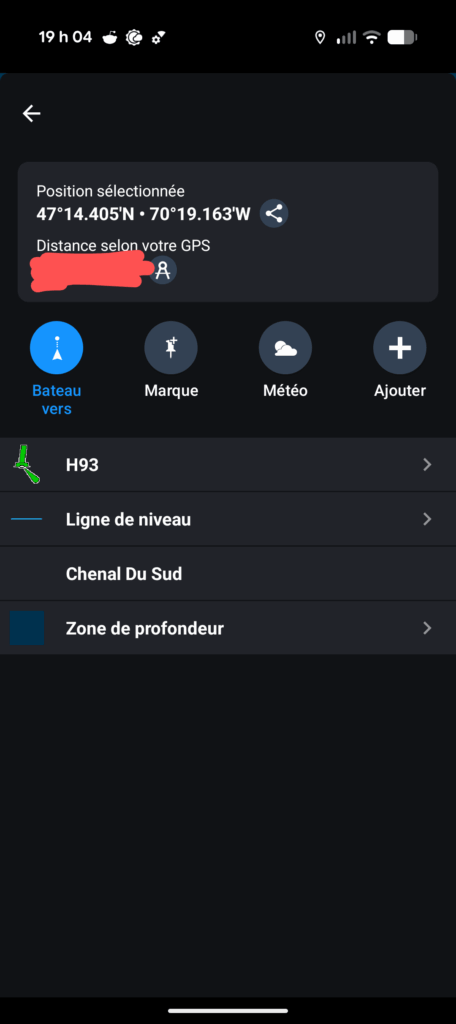
The application will then display all mapped objects located at the geographical point targeted by the crosshair. There is usually more than one. Select the one you’re interested in to get the associated information.
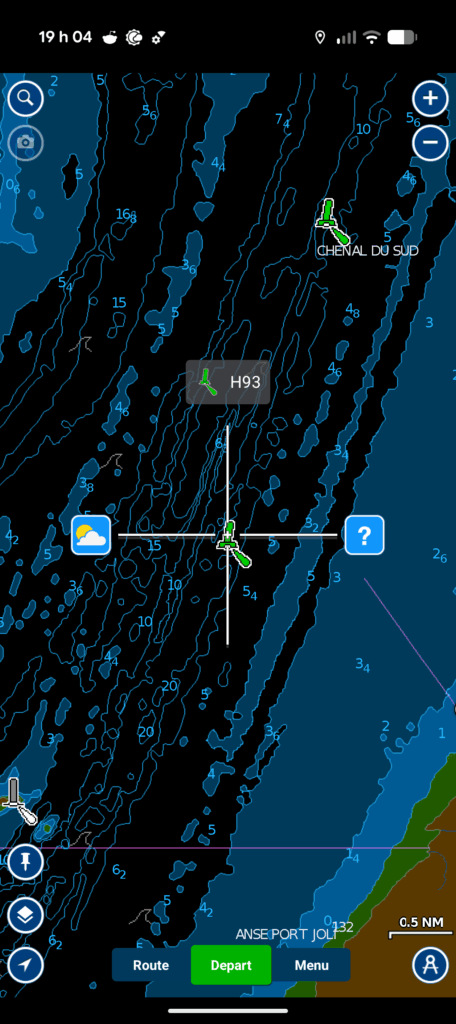
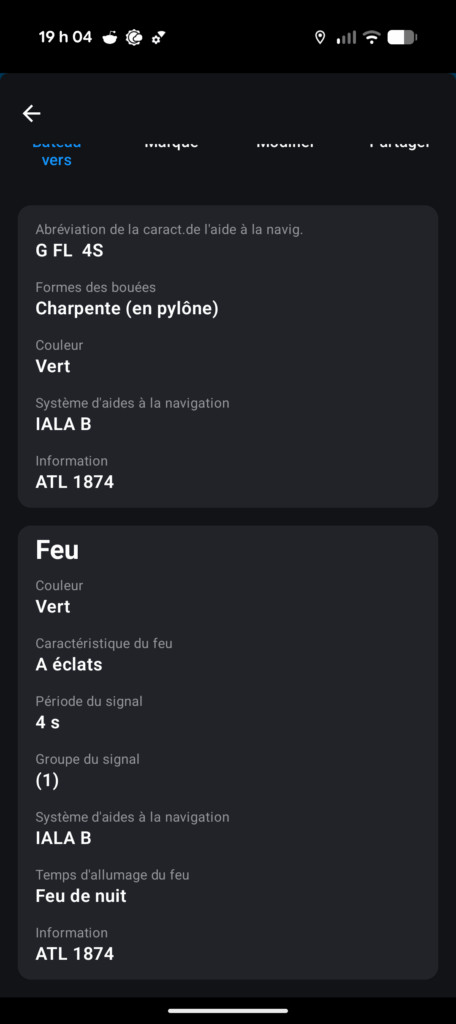
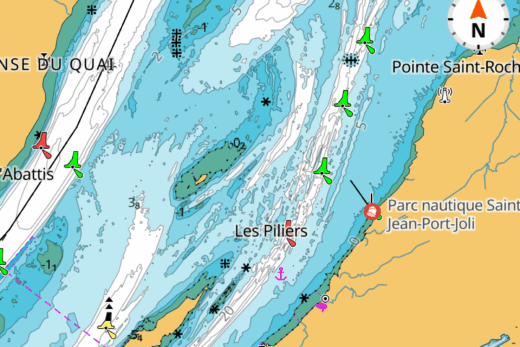
The images accompanying this section of the text show that the reticle is targeted on buoy H93, near St-Jean-Port-Joli. Clicking on the detailed information menu reveals that the electronic chart contains four objects at this point: the buoy, the isobaths, the name of the sailing channel and the depth zone.
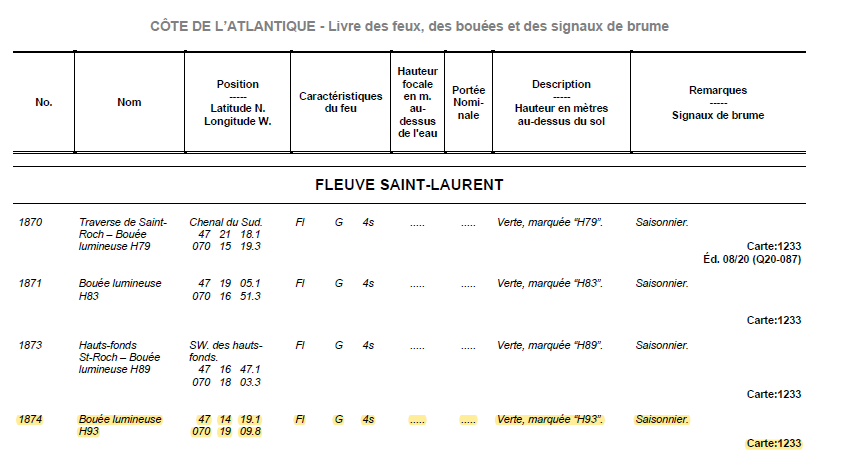
You can then place your finger on the object of interest to find the recorded information. On the left, we see detailed information on buoy H93, a green-framed buoy with a green flashing light that lights up every four seconds (G FL 4S). We can also see its number (ATL 1874), which corresponds to its official designation in the Atlantic Lights, Buoys and Fog Signals Book (image below).
Although the information presented by the application is fairly complete, it omits some information. In particular, the application fails to mention that buoy H93 is only present during the summer season.
Once you have understood how to move the crosshairs, you can find virtually all the information on each of the symbols.
Measuring distances and angles
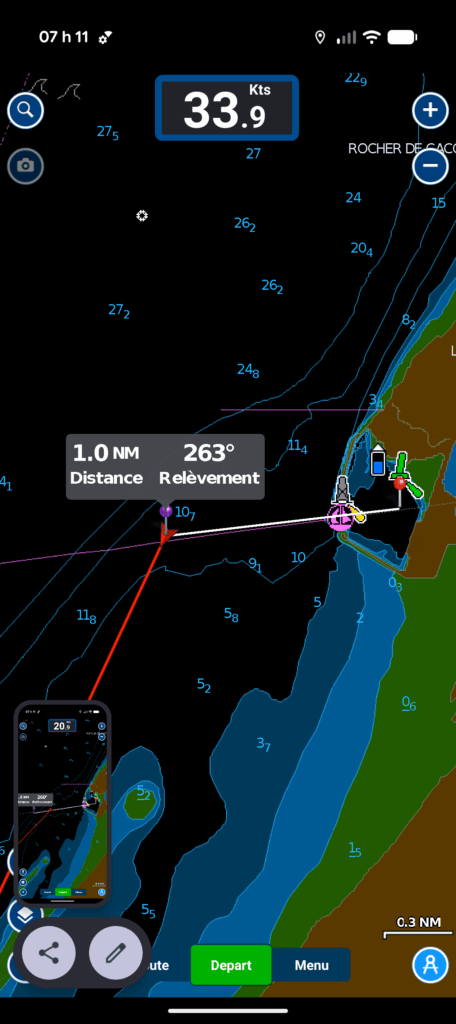
Angles and distances are measured using the compass instrument at the bottom right of the screen. Pressing the key reveals two pins connected by a line. One pin is purple and the other is red. The distance measured is that between the two pins (the line). The angle measured is that which the line makes with north. A pop-up window displaying the distance and angle also appears.
In the image on the left below, we can see a distance between the position of a ship (the red arrowhead) and the port of Gros-Cacouna. The distance displayed is 1 nautical mile(1.0 NM). This distance is displayed because the pins coincide with the ship’s position and the port. By moving the pins to any point of interest, you will be able to establish any desired distance.
Bearings are measured in degrees true, following the usual convention of measuring from north. The bearing displayed always assumes that the last pin moved is the destination (regardless of color). In the image on the left below, the bearing displayed is 263 degrees, meaning that the route between the port of Gros-Cacouna and the ship is 263 degrees true.
If you wish to see the reverse direction, simply move the red pin and the application will display the reverse bearing, i.e. 083 degrees true. The interpretation is that the ship must follow a course of 083 degrees true to enter the port of Gros-Cacouna (note: this corresponds approximately to the alignment shown on the chart). By moving the pins to any point of interest, we can find the bearings of interest.
Learn about currents and tides
Tides
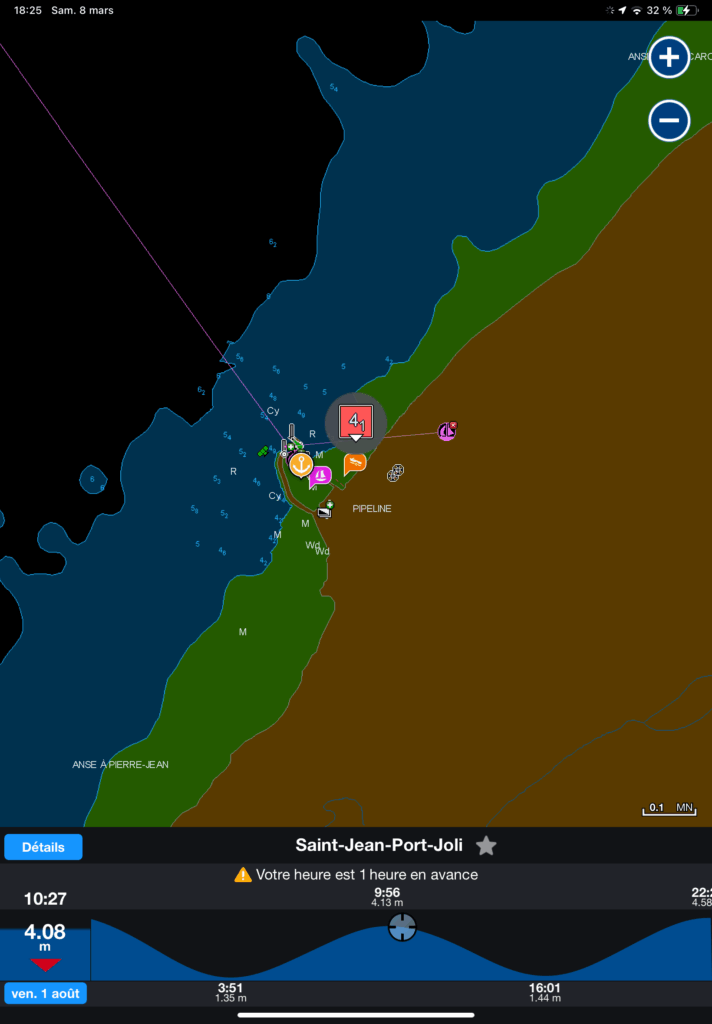
Note: this section is a reproduction of the section of the text on determining a tide window. It illustrates how to find tide information for St-Jean-Port-Joli. You can, of course, do the same for other tide stations.
The Navionics application doesn’t invent anything. It simply reports the tide station information available on the marees.gc.ca website. The information is displayed directly on the map.
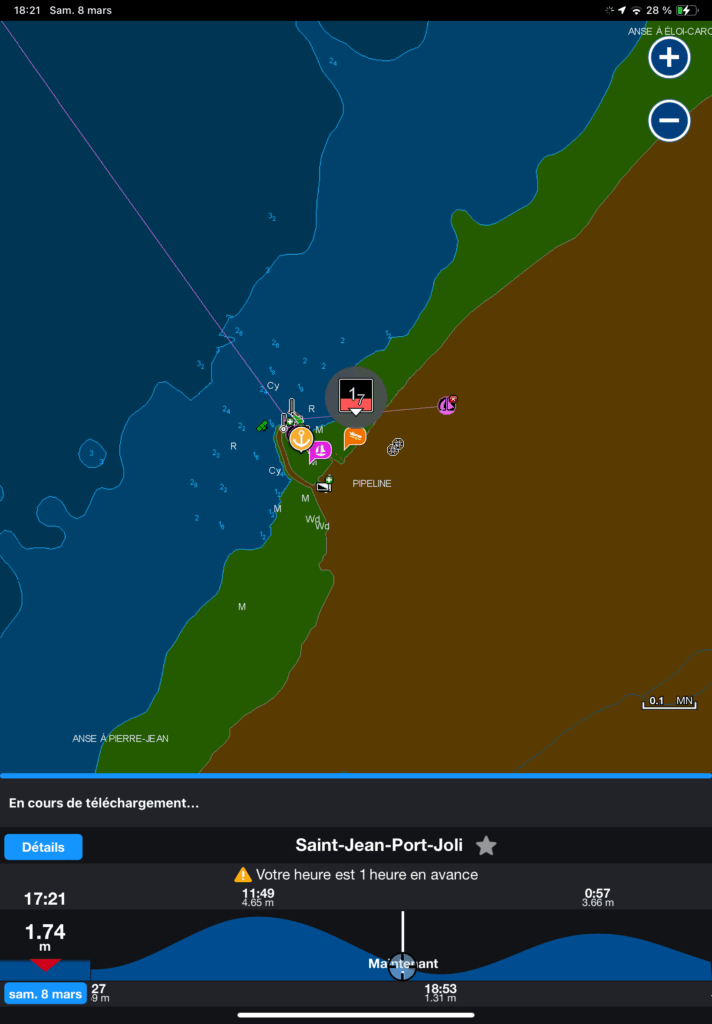
The application automatically displays the tide stations. These are small black rectangles, sometimes with a red gauge (as in the image), sometimes with a blue gauge (unillustrated). Red is a visual indication that the tide is ebbing. Blue is a visual indication that the tide is rising. To obtain the tide, we need to choose the gauge closest to the location we’re interested in. This is done by placing the crosshairs on the tide station, then tapping on the detailed information menu.
The image below (left) shows the tide cycle window when the gauge has been correctly clicked. It is compressed at the bottom of the screen. Navionics displays the actual water level (chart zero tide level) directly on the screen as long as you are in the tides pop-up menu. So you can see the predicted water level according to the tidal cycle.
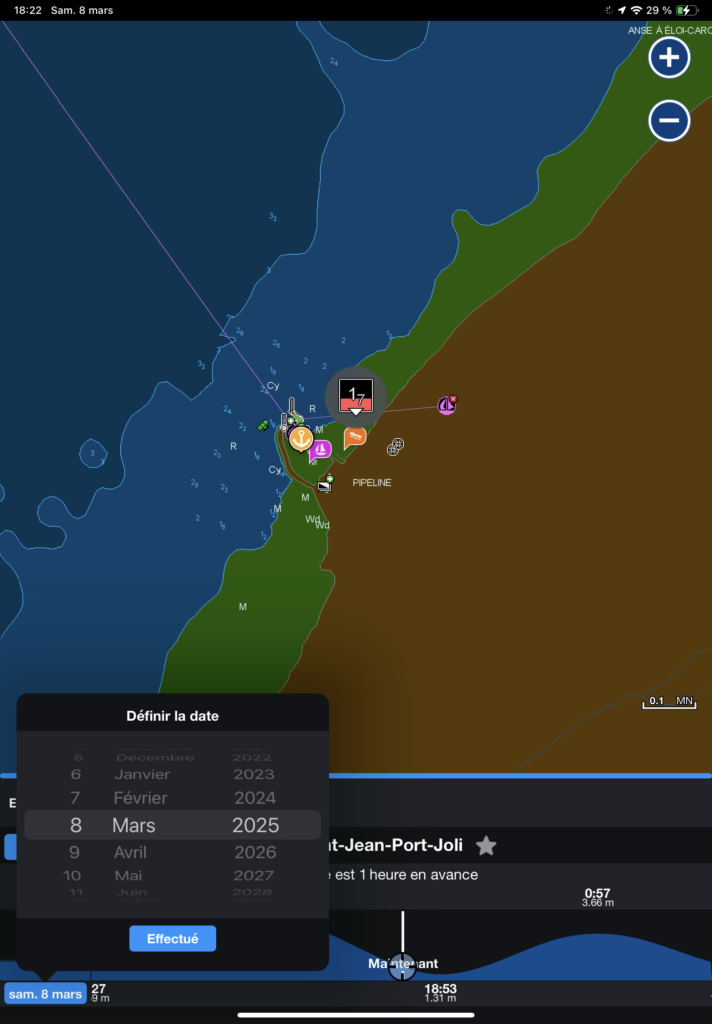
Choosing the right date is as simple as using the contextual menu at the bottom left of the screen (see image below). By moving the wheels, you can identify the date you’re interested in, and the application will load the tide data for the day of interest.
To interpret the tide data, move the cursor at the bottom of the tide window. You can then find the time of low tide, high tide, or the water level at any time of the day.
Please note that the times presented in Navionics are necessarily those of your electronic device’s time zone. In the images in this text, the tablet is in the Caribbean time zone (!), so the time is ahead of schedule. Therefore, in the images below, you need to add an hour to find the Quebec time. If your tablet or cell phone is on Quebec time, no adaptation is necessary.
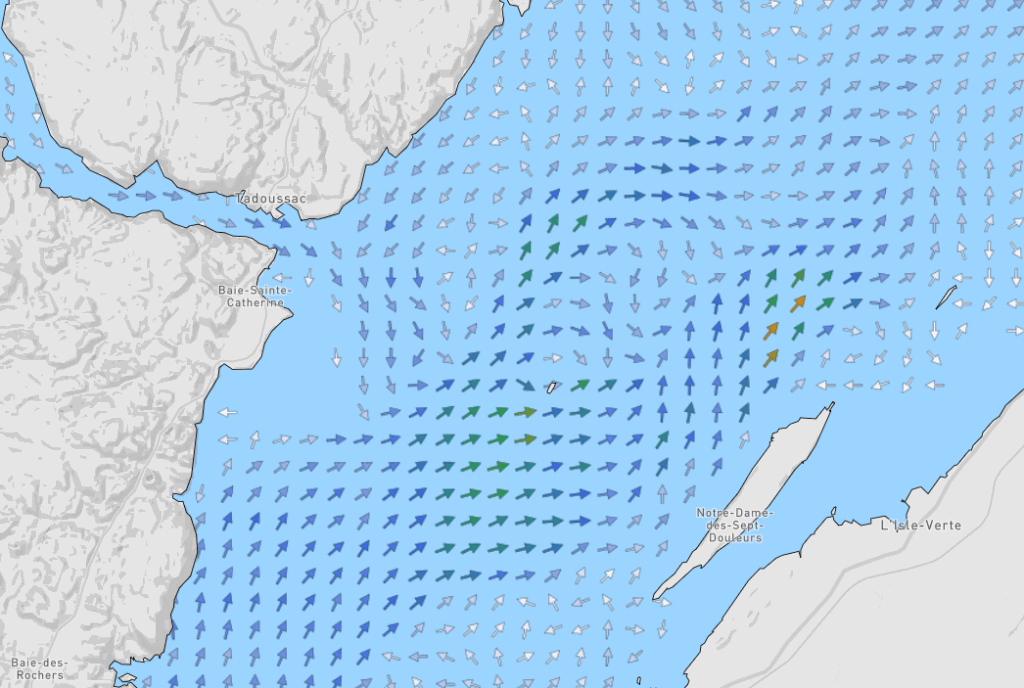
Currents
The method for assessing currents is similar to that for assessing tides. Identify a “current station” on the water, place the crosshairs there, and click on the detailed information menu to obtain the current status. These can be obtained in real time, in a similar way to the tides, but you can’t choose a date and determine the direction and magnitude of the current at the station indicated. The images below illustrate the essentials of the method.
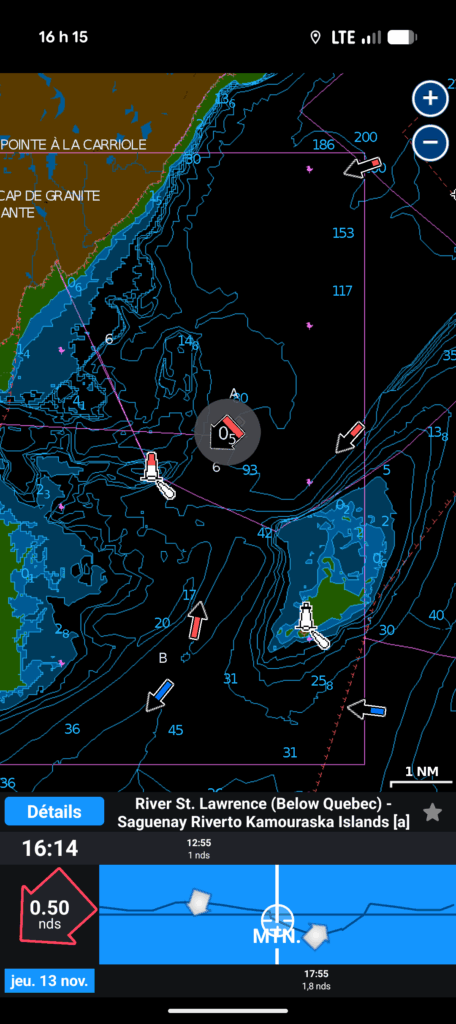
A comparison of the currents displayed by Navionics with those of the St. Lawrence Global Observatory shows a problem, however. Manual calculations from the Current Atlas coincide with those of the Observatory, but not with those of Navionics. In other words, Navionics is displaying the wrong current information on the St. Lawrence River!
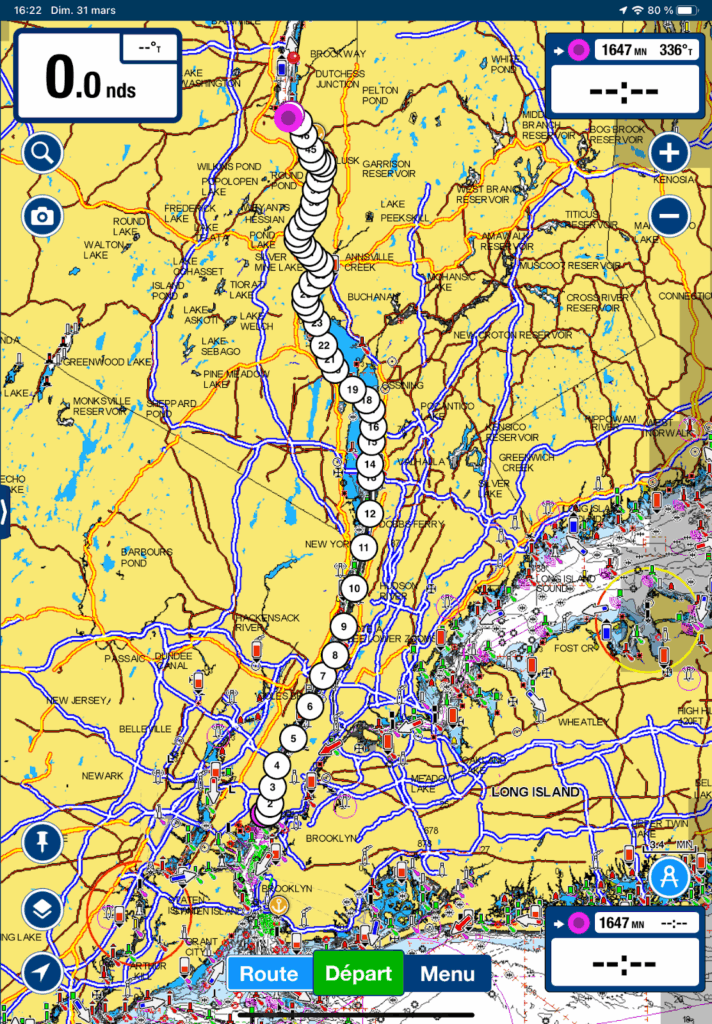
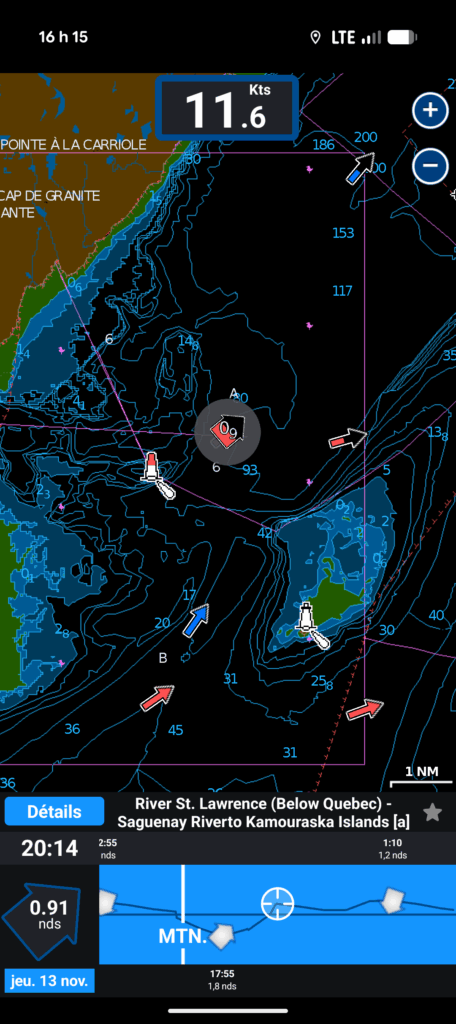
Evaluating speed and course on the ground
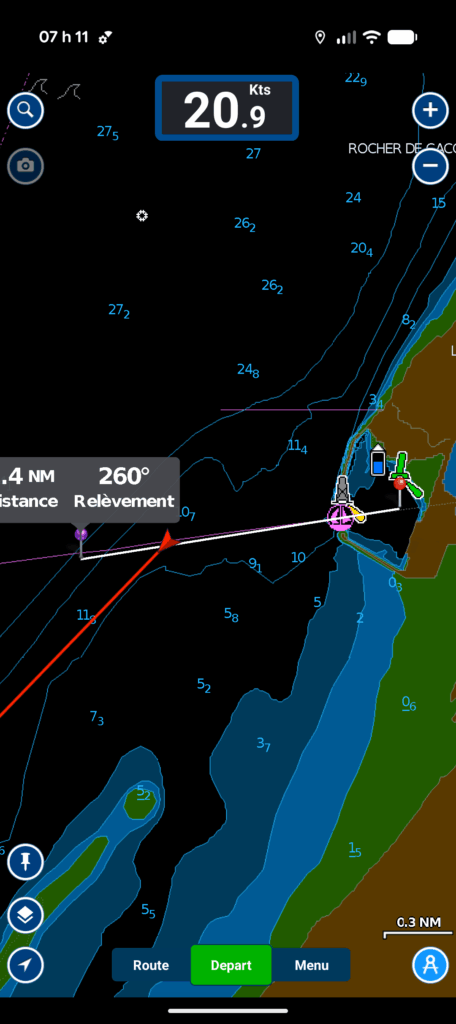
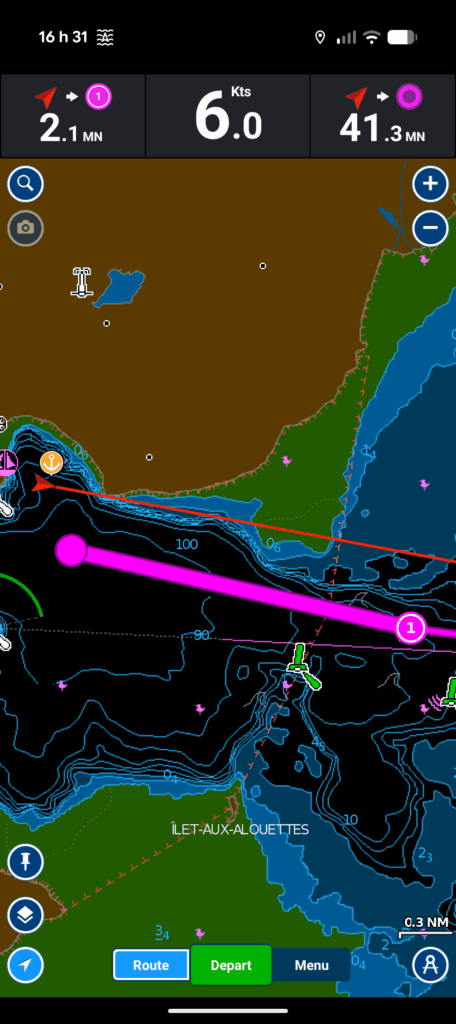
As long as the electronic application’s GPS is activated, the evaluation of speed over ground (SOG) and course over ground ( COG) is automatically displayed on screen. The ship is represented by a red arrowhead, and the course over ground is the red line extending from the arrowhead.
In a nutshell, the course over ground is the direction in which the ship is heading, taking into account the effect of winds and currents, as opposed to the direction in which the ship is pointing (the course). Similarly, speed over ground is speed over land, not speed over water (as displayed by a log). If you are unfamiliar with these concepts, I encourage you to take a navigation course.
The Navionics application automatically displays speed over ground at the top center of the window. In the image on the right, the speed displayed is 20.9 knots (Kts: knots), a speed hardly achievable with a pleasure sailboat! This means that the ship is travelling at 20.9 nautical miles per hour in relation to land.
In the same image, the course over the background is indicated by the red arrow and is approximately south-west (225 degrees true).
Planning and executing routes
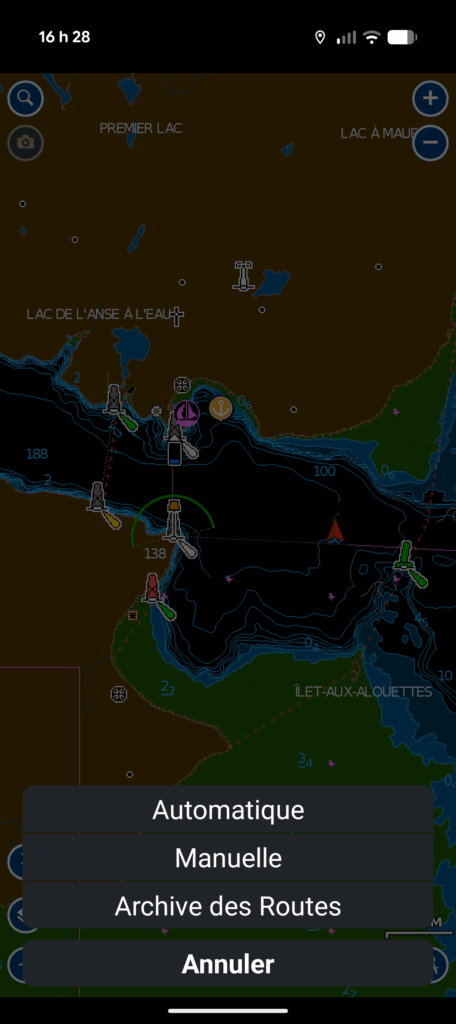
Route planning is carried out via the “Route” menu in the bottom right-hand corner of the application window. Both manual and automatic options are available.
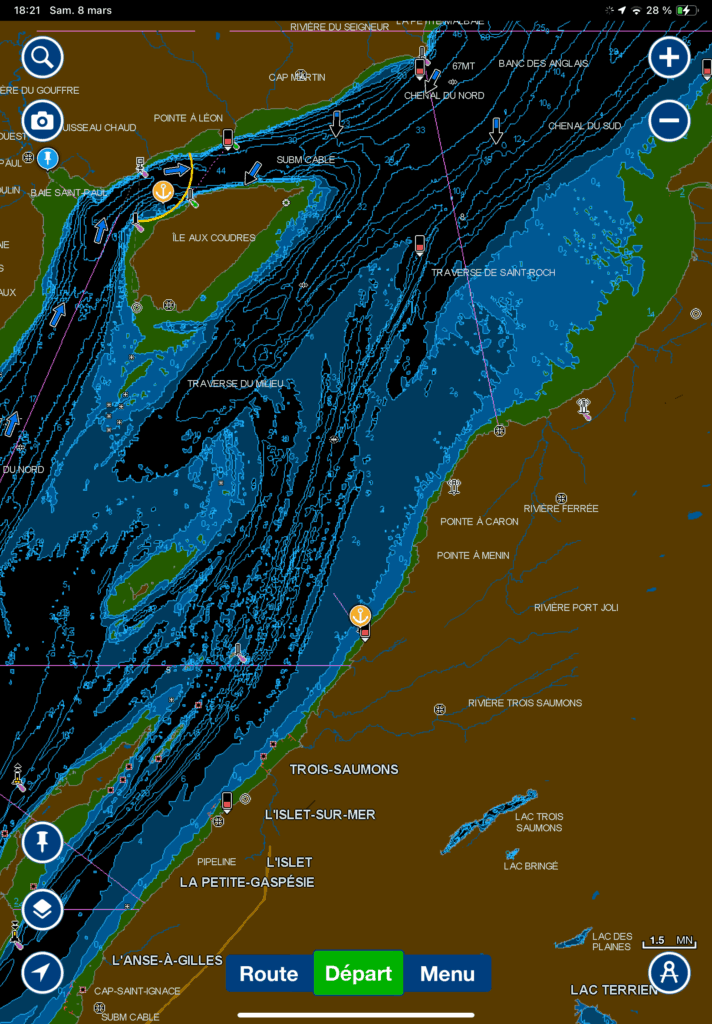
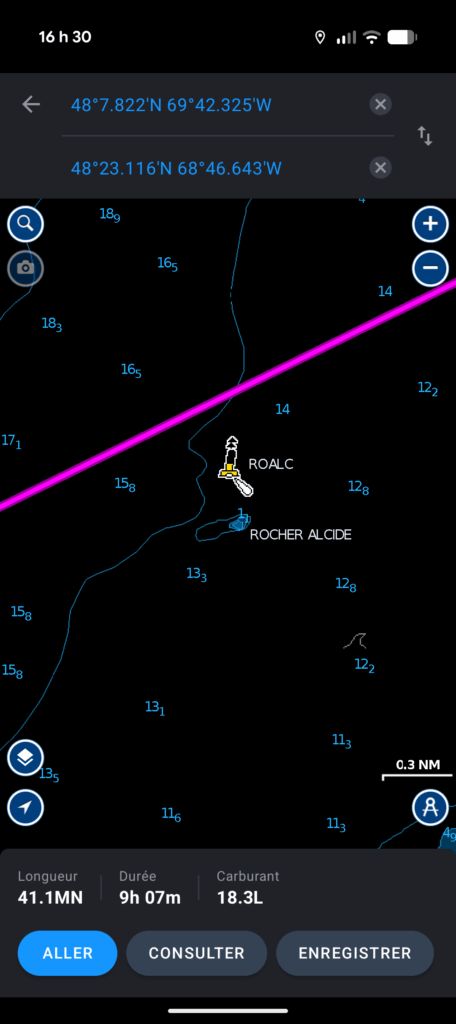
The manual option lets the user place thewaypoints that make up the route. Once in manual mode, simply press and hold a geographic point on the map to add it to the current route. Points are added one after the other. Below, I illustrate a route on the background between Tadoussac and Le Bic.
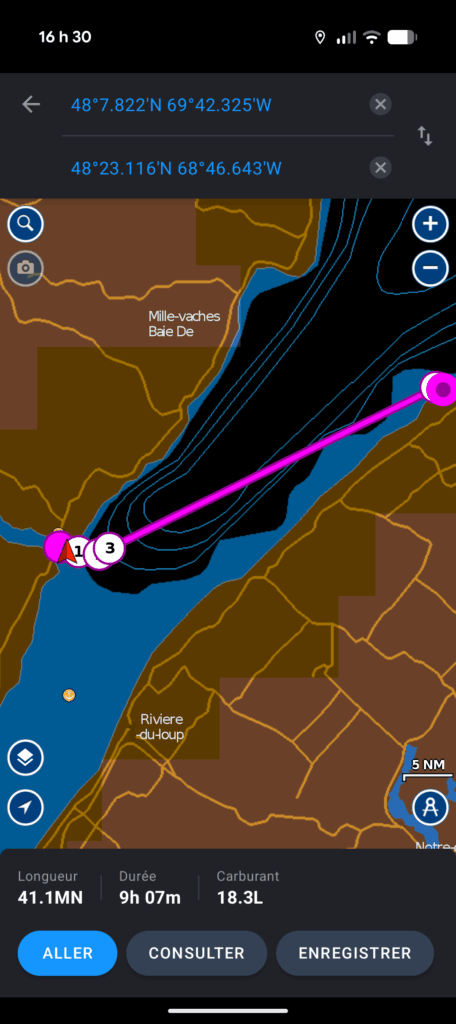
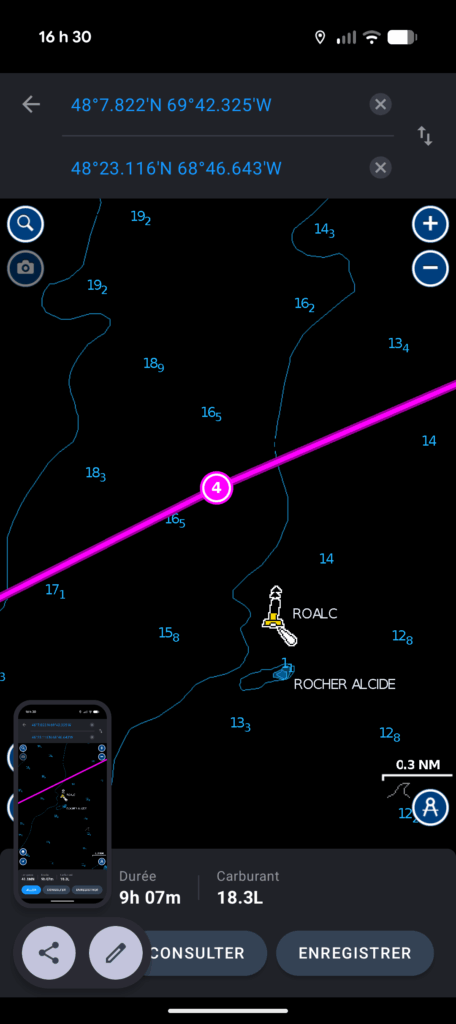
A notable shortcoming of electronic maps is that they hide navigation objects at low resolution (when you cover a large distance with the screen). It is therefore good practice to go back to the route drawn at high resolution (by “zooming in”) to check that the route does not pass through objects that are not hidden at low resolution. In the example route below, an examination at high resolution suggests that we may be passing too close to the Alcide Rock cardinal buoy.
You can modify the route by adding an intermediate waypoint. Simply long-click on a road segment, then move the selected point to the desired location. Navionics will then understand that a new point has been created at the point where you released it.
Navionics also offers the option of automatic route planning. This should be used with great caution, as it lets the computer determine where to go without necessarily taking into account any safety considerations that may apply. In particular, an automatic route will not take into account any navigation warnings in force. It is an essential practice to review an automatically created route for hazards before using it.
Exchange previously planned routes
Navionics allows you to download routes produced by other applications. Similarly, you can export routes produced on Navionics. The exchange format is .gpx, an open standard. This is a convenient way of sharing a route from one person to another, without that person using the same navigation application as you.
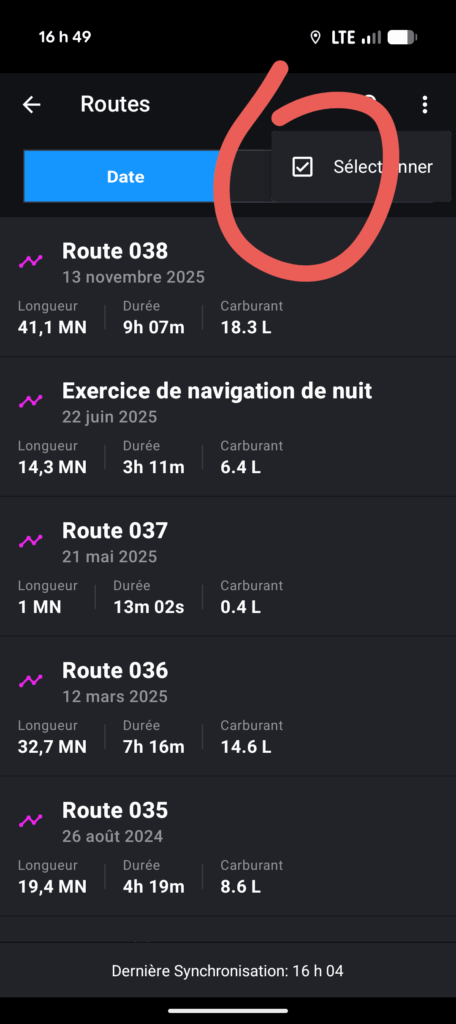
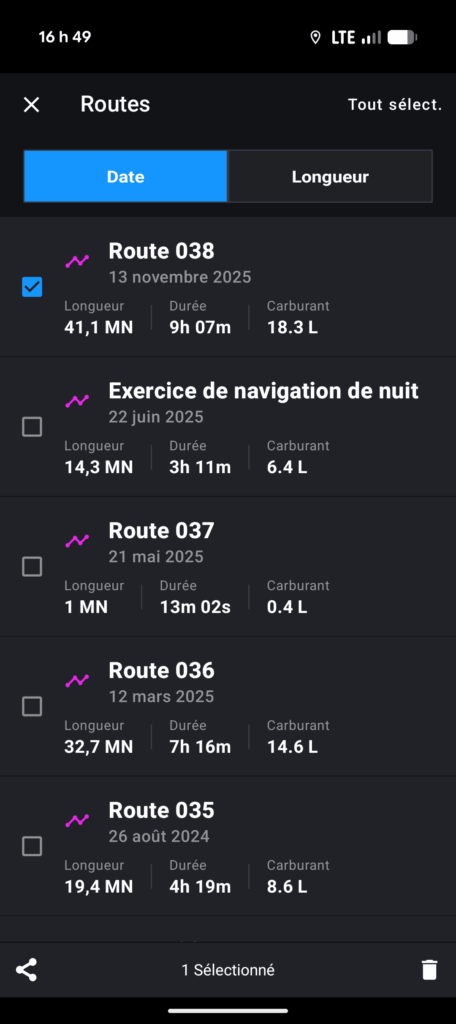
To export a route, go to the route archive menu by clicking on “route”, then “route archive”, then choose the selection menu in the top right-hand corner. Then select the route you wish to export, and click on the share button. Finally, select the “export to .gpx format” option. The images below summarize how to do this.
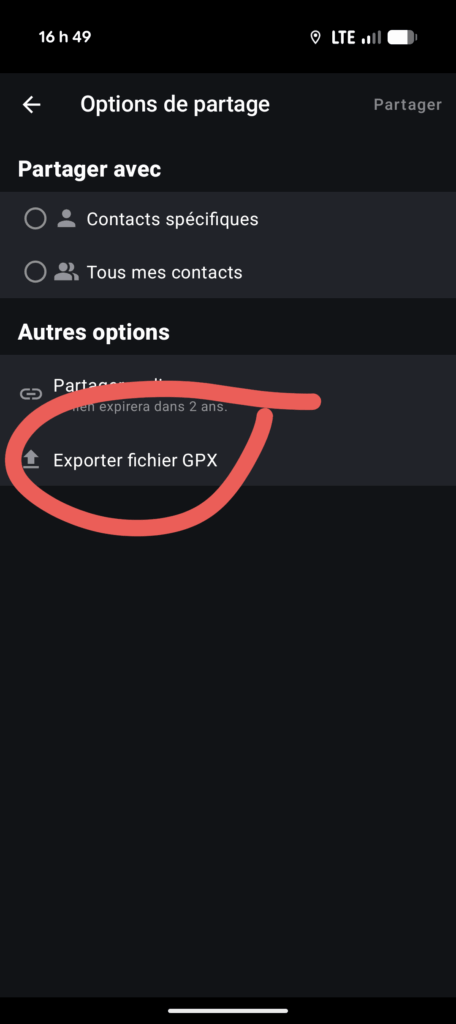
Navionics offers the option to “share a route with a friend”. This option will require your friend to install Navionics on his or her device in order to access the route. It’s more a way of forcing the use of the application than of sharing a route! On the other hand, exporting in .gpx format will be supported by most other navigation applications.
To load a .gpx route into Navionics, simply click on the route once it has been downloaded. Navionics will then open automatically. If you have more than one navigation application installed on your device, it’s possible that another application will open instead of Navionics. In this case, you need to tell your operating system which application to use to open the .gpx files.
Recording the actual route taken
To save the track of your boat, use the start button at the bottom of the screen. This saves the history of the ship’s actual position and displays it on the map. This is very useful for retracing your route on badly marked stretches of water.
As soon as you activate the track, the Navionics screen will display a pop-up bar containing elapsed time, average speed over ground and distance covered. This bar is displayed at the top of the screen.
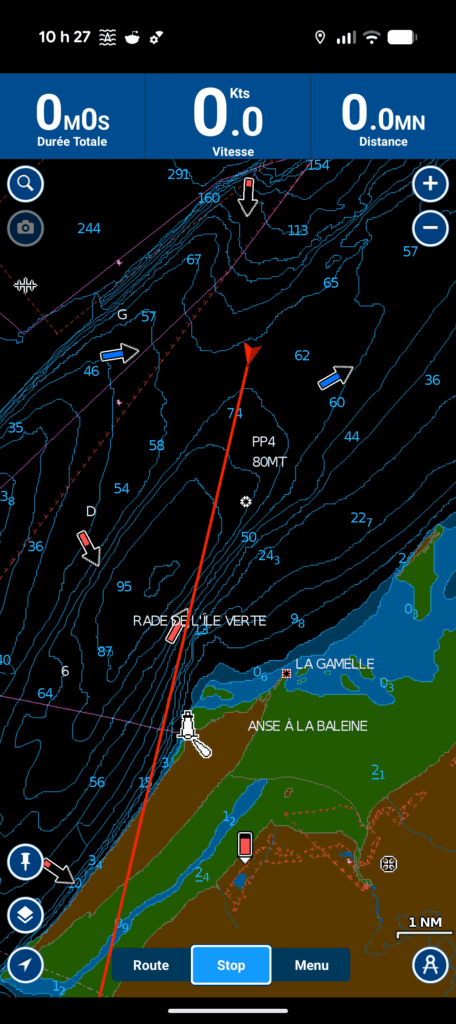
In the image on the left below, you can see the contextual bar at the start of activation (everything is at zero). Note that the “start” button has been replaced by the “stop” button (bottom center), implicitly signifying that the application is in tracking mode.
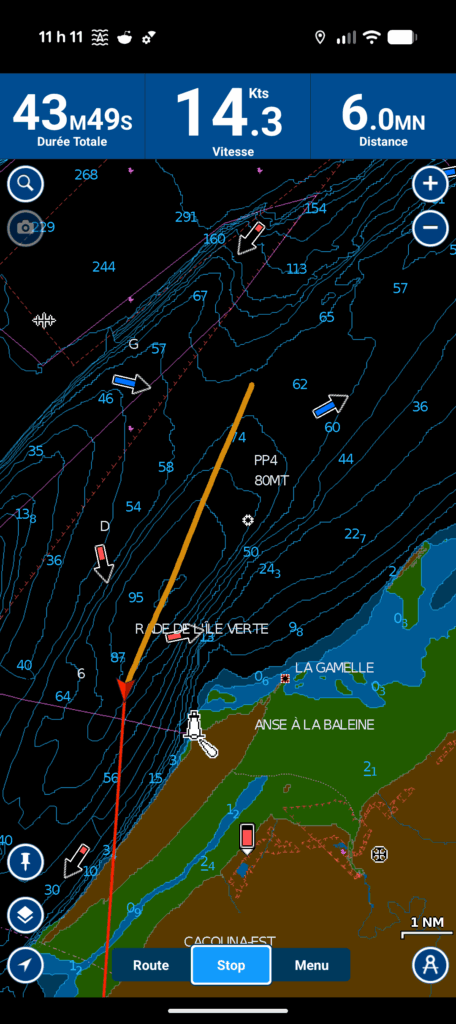
In the center image below, we can see the route taken by the ship (its track) and the navigation statistics after 43 minutes, 49 seconds of navigation. The average speed is 14.3 knots (over ground) and the distance covered is 6.0 nautical miles. In the image, the track is a straight line because the ship went in a straight line, but it must be understood that if the ship had changed course, the track would have incorporated this turn.
Conclusion
Navionics is an e-navigation application that can be used for most common navigation tasks. Its biggest shortcoming is the poorly calculated currents on the St. Lawrence River (and perhaps elsewhere).
The few options for configuring the display are also worth mentioning. It is not possible, for example, to remove certain information from the map. It is, however, possible to change the units displayed, as well as to change the map colors to night or day. There are some advanced options which are not covered in this text. The most important is connecting the application to the yacht’s AIS. Please refer to the manufacturer’s instructions.
All in all, it’s a handy pocket application. To assess the state of navigation while remaining in the cockpit, just take a quick look at your phone.
10 Responses
[…] It focuses on the C-MAP application. The other texts cover the use of OpenCPN, Savy Navy, Navionics and SEAIQ. It focuses mainly on installations on tablets or cellular devices that are not connected […]
[…] It focuses on the C-MAP application. The other texts cover the use of OpenCPN, Savy Navy, Navionics and SEAIQ. It focuses mainly on installations on tablets or cellular devices that are not connected […]
[…] ait l’application Savvy Navvy installée pour être en mesure de de la voir. Contrairement à Navionics, OpenCPN et C-MAP, il n’est pas pas possible d’échanger des routes entre des […]
[…] charts. For concrete examples, this site includes five introductions to different applications: Navionics (Boating), OpenCPN, C-MAP, Savvy Navvy and SEAiq. Below, I detail the elements common to navigation […]
[…] other texts cover the Navionics (Boating), C-MAP, OpenCPN and SEAIQ applications respectively. This text assumes that the application is […]
[…] other texts cover the Navionics (Boating), Savvy Navvy, C-MAP and SEAIQ applications respectively. Before reading this text, it’s a […]
[…] montre un deuxième exemple, cette fois avec l’application électronique Navionics (Boating). La carte montre Port meunier, au sud ouest de l’Ile d’Anticosti. L’échelle est […]
[…] show a second example, this time using the Navionics (Boating) electronic application. The map shows Port meunier, south-west of Anticosti Island. The scale is 3 […]
[…] have written five texts describing the use of the electronic navigation applications: Navionics (Boating), C-MAP, OpenCPN, Savvy Navvy and SeaIQ. Each text examines hot to perform eight essential […]
[…] other texts in this series cover the use of the Navionics (Boating), OpenCPN, Savvy Navvy and C-MAP applications. As prior reading, the texts Introduction to […]