This text is the second in a series of five on electronic navigation applications. It shows how to use the OpenCPN application to perform eight essential navigation tasks:
- how to obtain electronic charts
- read map symbols;
- measure distances and angles;
- find out about currents and tides;
- evaluate speed and course on the bottom;
- plan and execute routes;
- exchange planned routes;
- record the actual route taken.
The other texts cover the Navionics (Boating), Savvy Navvy, C-MAP and SEAIQ applications respectively. Before reading this text, it is a good idea to read the Introduction to Electronic Navigation Applications text, as it applies to all navigation applications. It is also a good idea to understand the text on electronic chart formats. It should also be noted that this is not a text explaining how to make a navigation plan, but rather how to use the application.
OpenCPN
OpenCPN is an application for displaying electronic charts. It is opensource and maintained by a community of navigators. It can be downloaded for PC, Mac, Linux and Android tablets and cell phones. However, it is not available on iPads/iPhones.
Its open format means that it accepts a wide variety of map sources and formats. In particular, you can import your own electronic maps (such as Pilot Charts), or download free maps from the USA and other countries. It is also an application that can be installed on Raspberry Pi computers, enabling diy-ers to install a home-made on-board computer on a sailboat. It can also be used to install a large number of additional modules (plugins) to enhance the basic application.
For the functions listed in this text, OpenCPN is easy to use. If you want to do more, you will need to be patient and make sure you have the computer skills required, for some installations can go wrong. My experience of adding additional modules, which is very limited, suggests that the application is generally better supported on PCs than on Macs.
It is an application I use mainly on a laptop, including a keyboard and trackpad. The paragraphs below are therefore written in terms of mouse clicks and keyboard keys, rather than actions such as “tapping the screen” or “pinching the screen”, typical of a tablet. Over time, I configured the application to suit my needs. It is possible that some of the screenshots below differ from a standard installation.
How to get charts
American charts
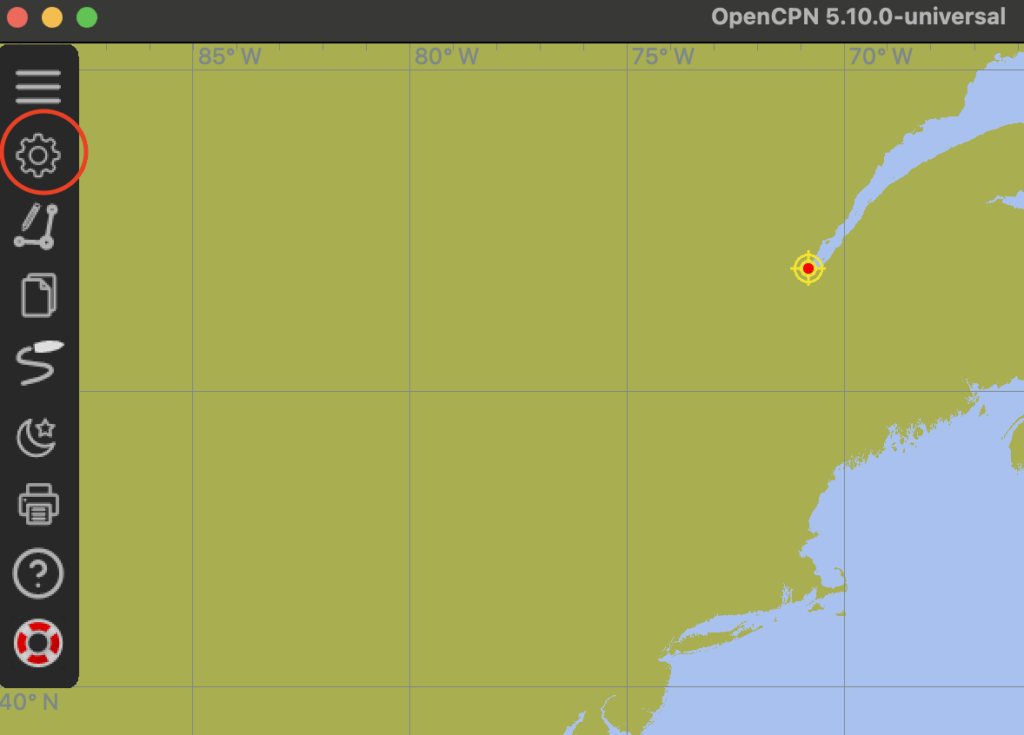
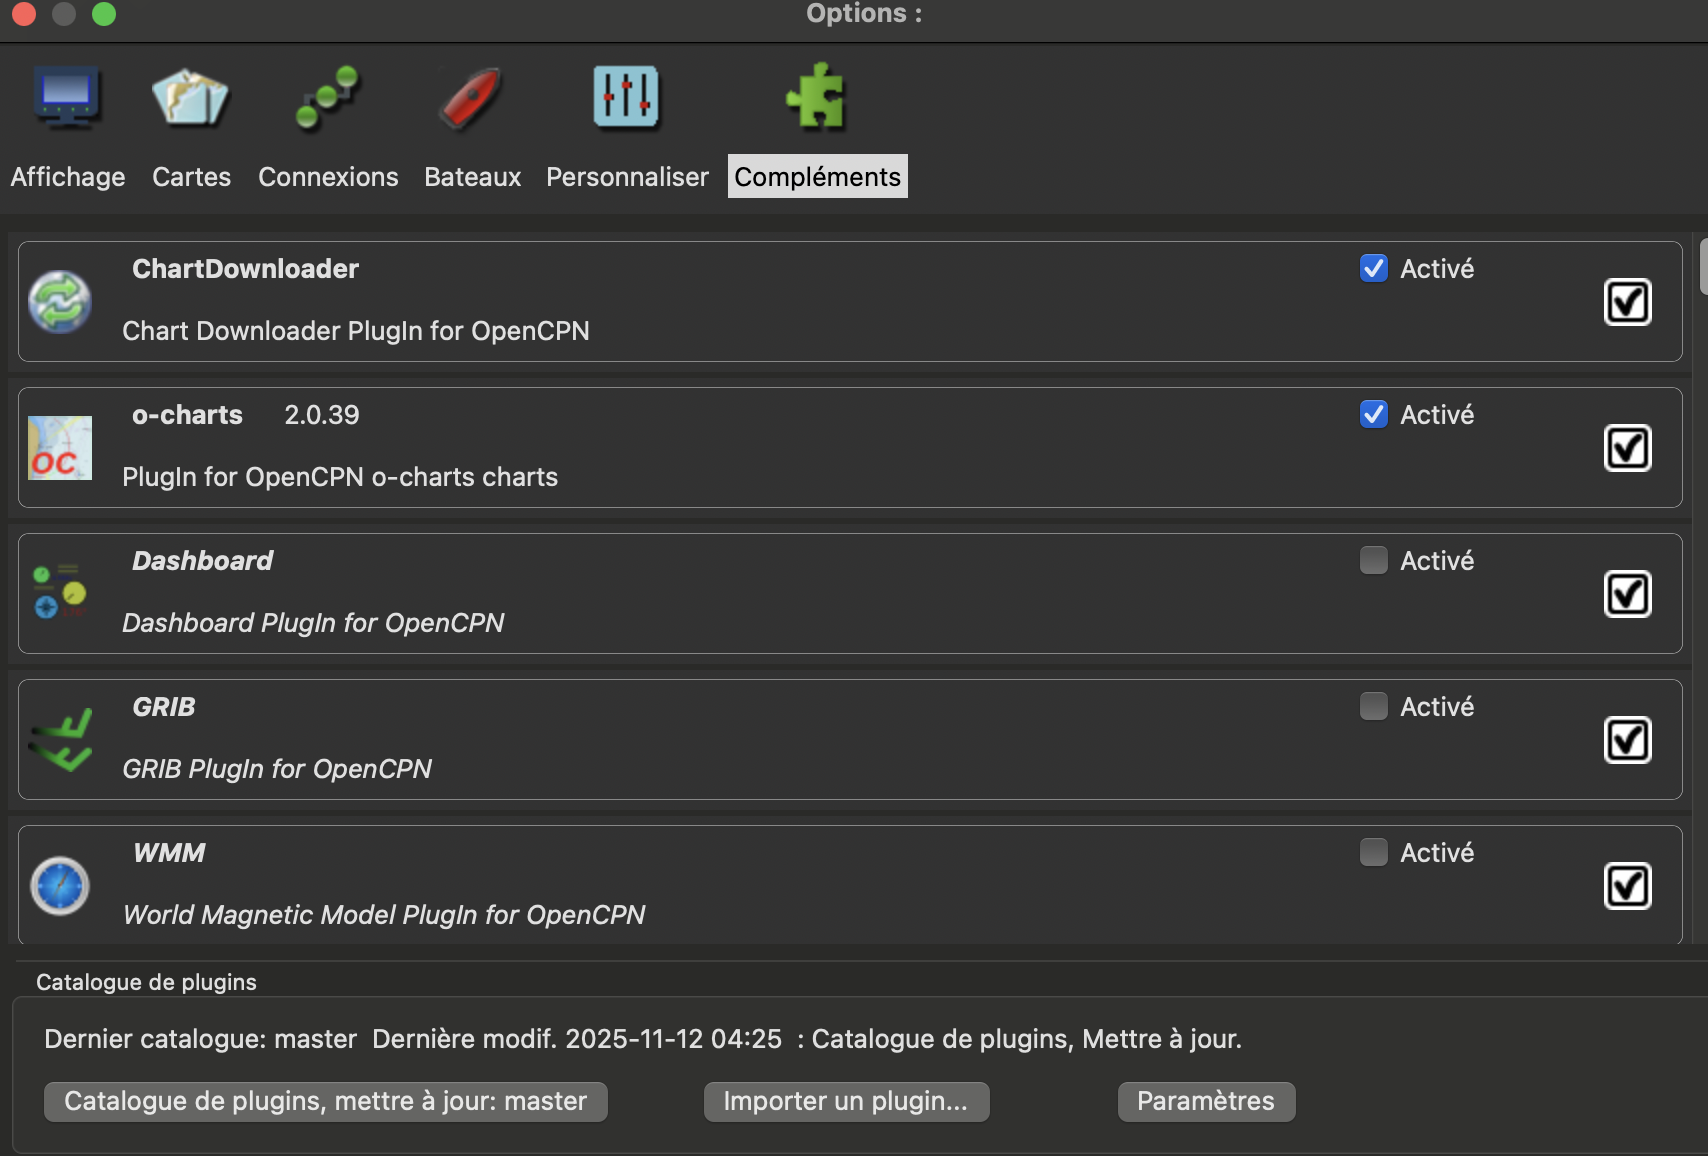
American (NOAA) charts are free of use. You can install NOAA charts by activating the ChartDownloader module included by default with OpenCPN. (You can also download them manually from this address). To activate the module, go to the “options” menu on the left of the screen, then “add-ons” and activate the ChartDownloader module. The images below show the options menu and the activated module respectively.
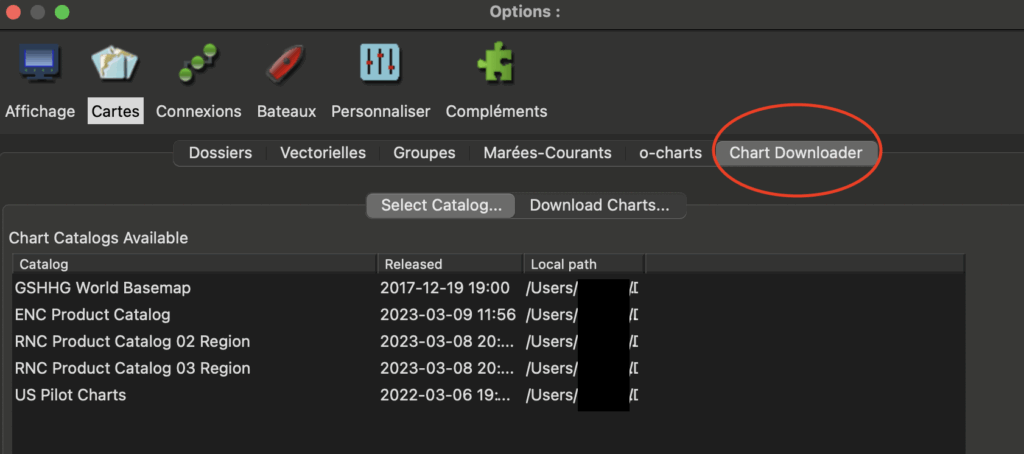
Once the module has been activated, you can return to the main options menu and select the “Chart” tab. The “Chart Downloader” tab should appear (if necessary, restart the application). The image below shows the tab. Because my version of OpenCPN includes charts already installed, the image shows my chart catalog. On a blank version of OpenCPN, there would be no chart catalog.
Next, click on the “Download charts” tab, then choose the American region you’re interested in. Once the region has been selected, you can click on “Download selected charts” to obtain them. Below, I’ve selected the “Cap Hatteras to Florida Straights” map (US2EC02M), a low-resolution map covering the southern US East Coast.
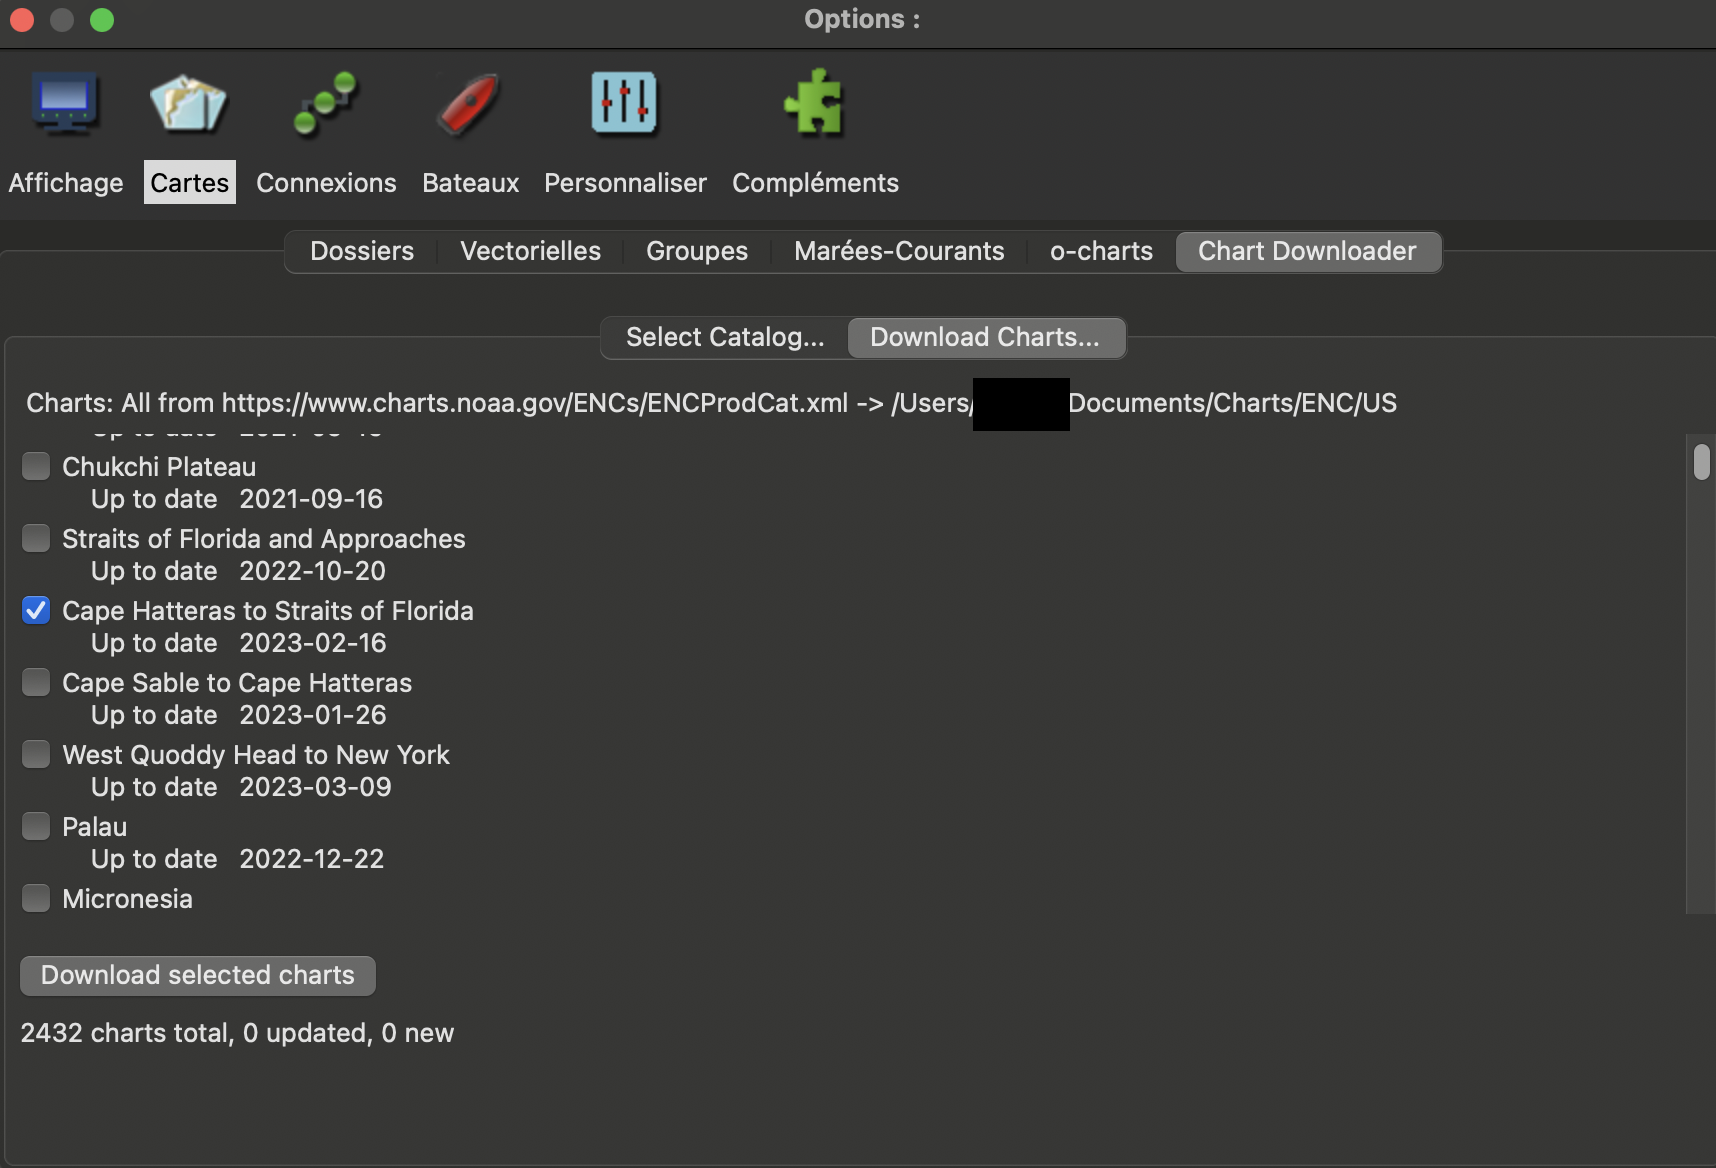
Once downloaded, the map will be processed by OpenCPN. Take care to download only the maps you need. Downloading will take less time, the maps will take up less space on your device… and the time it takes to install the maps in OpenCPN will be much shorter. It can take hours to process all the U.S. charts!
It is just a matter of repeating to download additional maps from the NOAA catalogs. For those seeking to add additional charts manually (obtained from CD, USB key, etc.), please read the procedure at this address.
Paid for charts
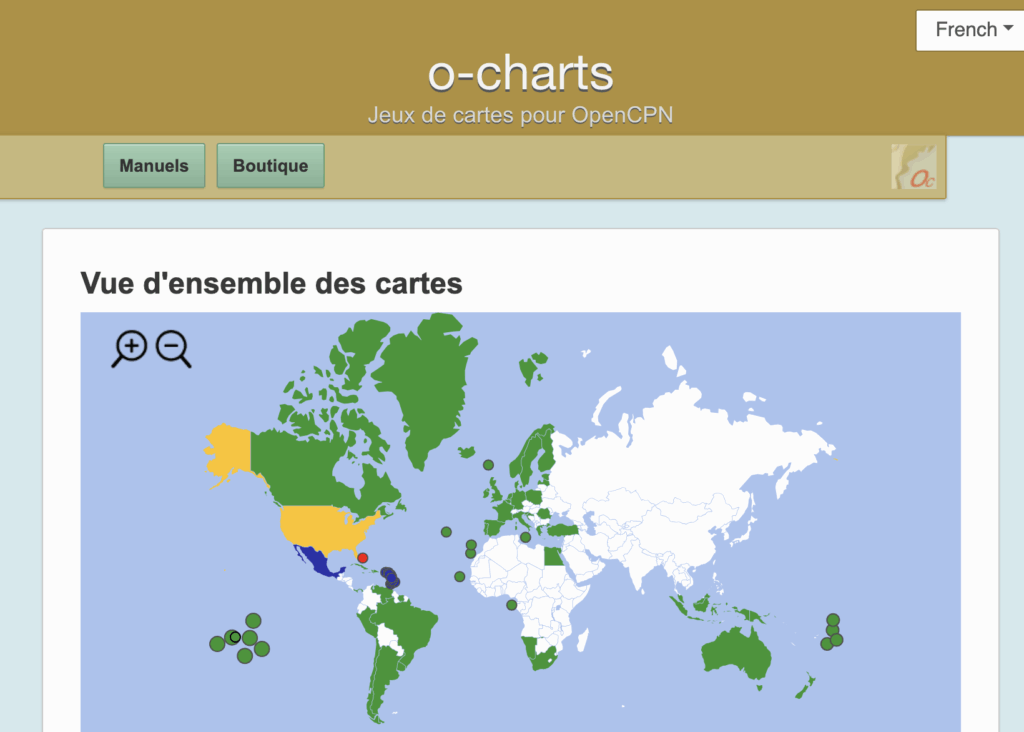
Not all countries offer free access to quality charts. In particular, Canada charges a fee. For OpenCPN, paid charts are available from the o-charts reseller, the software’s commercial website. You’ll need to create an account, and before making any purchases on the site, you’ll need to activate the o-charts module in OpenCPN.
This module makes your online purchases available on your software. The module is installed by default (and illustrated in the first Figure of the previous section). Once the module has been activated, you need to enter the user name and password created on the o-charts website. Your purchases will then be visible in your application.
There are two important facts to know about the OpenCPN business model. Firstly, purchased charts can be installed on up to two different devices at any one time. Once the devices have been chosen, they cannot be changed. The implication is that if you lose the computer where your charts are installed, you lose one of the two devices selected for installation! Once both installations are exhausted, you have to buy charts again. So remember: install your charts on the device where you plan to navigate!
OpenCPN only updates charts for one year. After that, you will no longer have access to chart updates. If you wish to extend the validity of the updates, you’ll need to purchase the charts again.
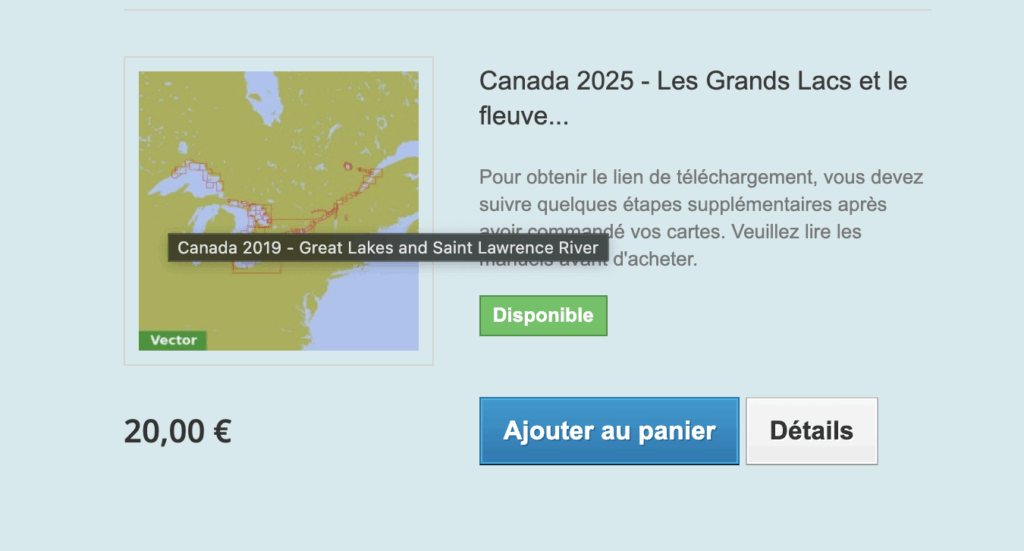
To purchase a chart, go to the o-charts website. Select the region of the world, then the country, and then the region of the country you’re interested in. Then add the chart to your shopping cart, and pay using an online payment method (credit card, paypal, etc.). The image below shows the main screen for purchasing East Coast Canadian cards. In 2025, the selling price will be 20 euros, or around 33 Canadian dollars.
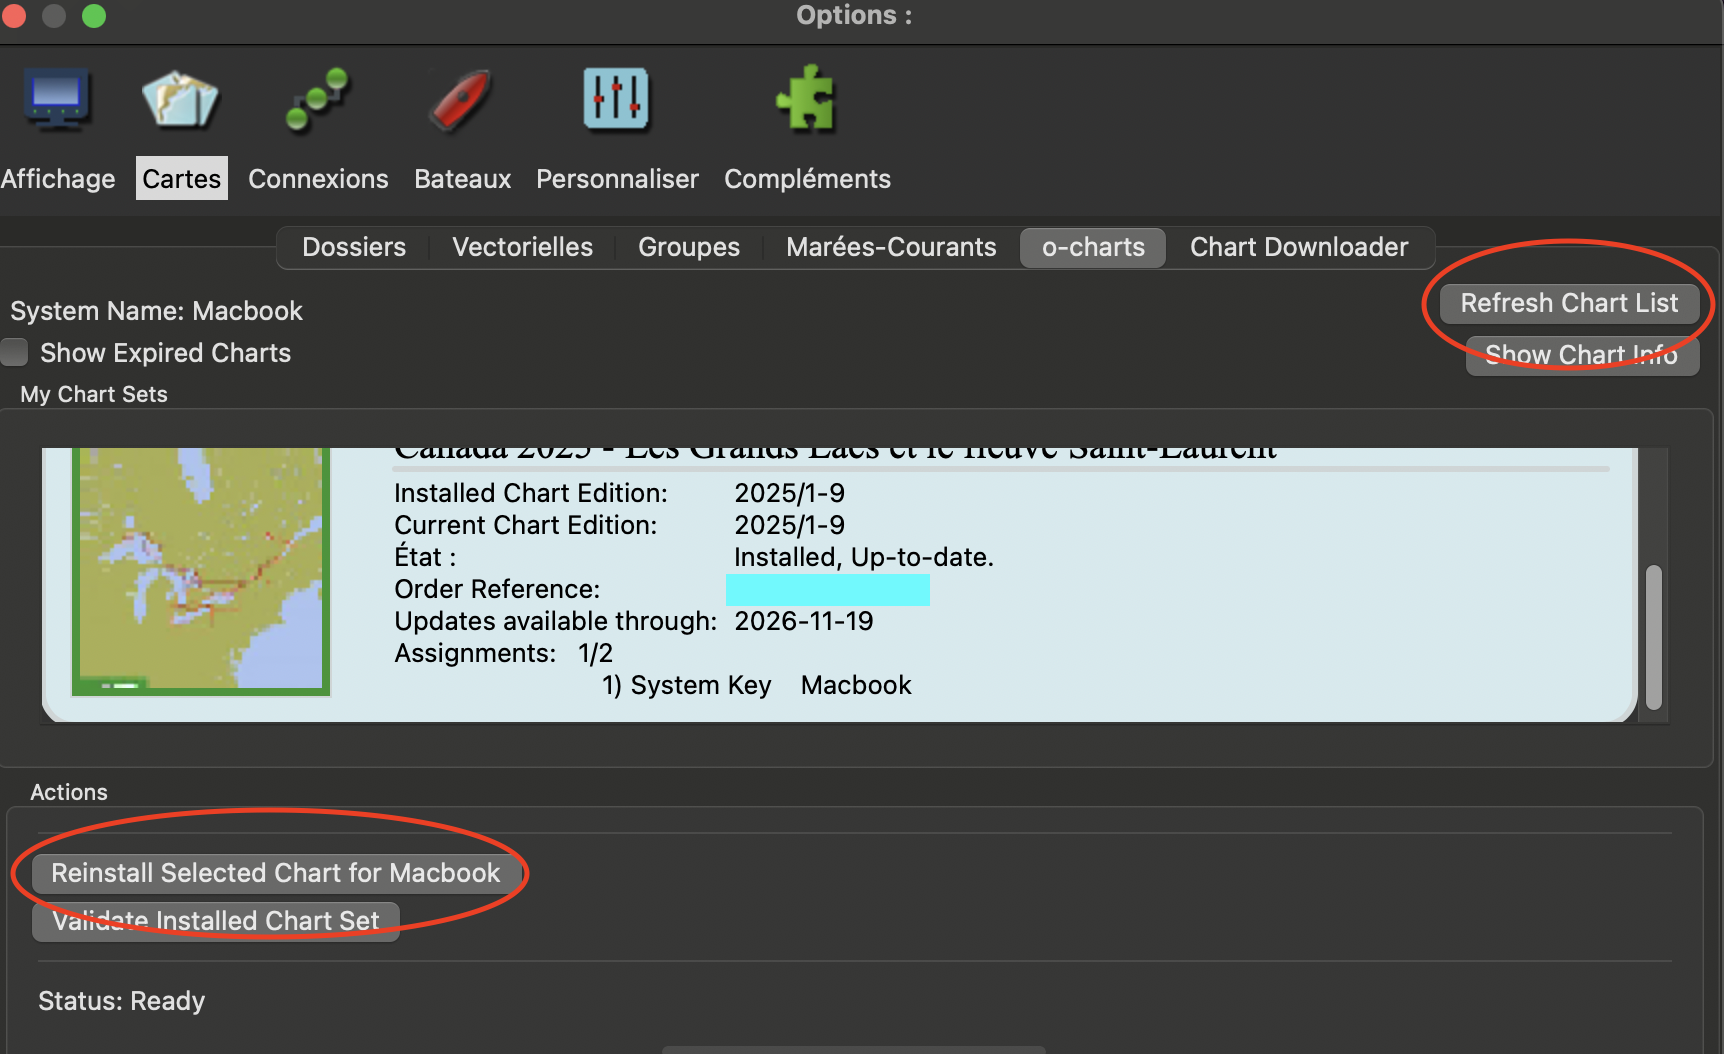
Once you have purchased the chart(s), you can return to OpenCPN’s o-charts menu, then press the “Refresh chart list” button. The purchased chart should then appear. You can then select it and click on “Install selected chart”. By doing so, you choose the device you’re working on as one of the two devices where charts can be accessed. The image below shows the two most important buttons for installation. In the image, however, the second button displays “Reinstall selected chart” because my computer already has charts installed.
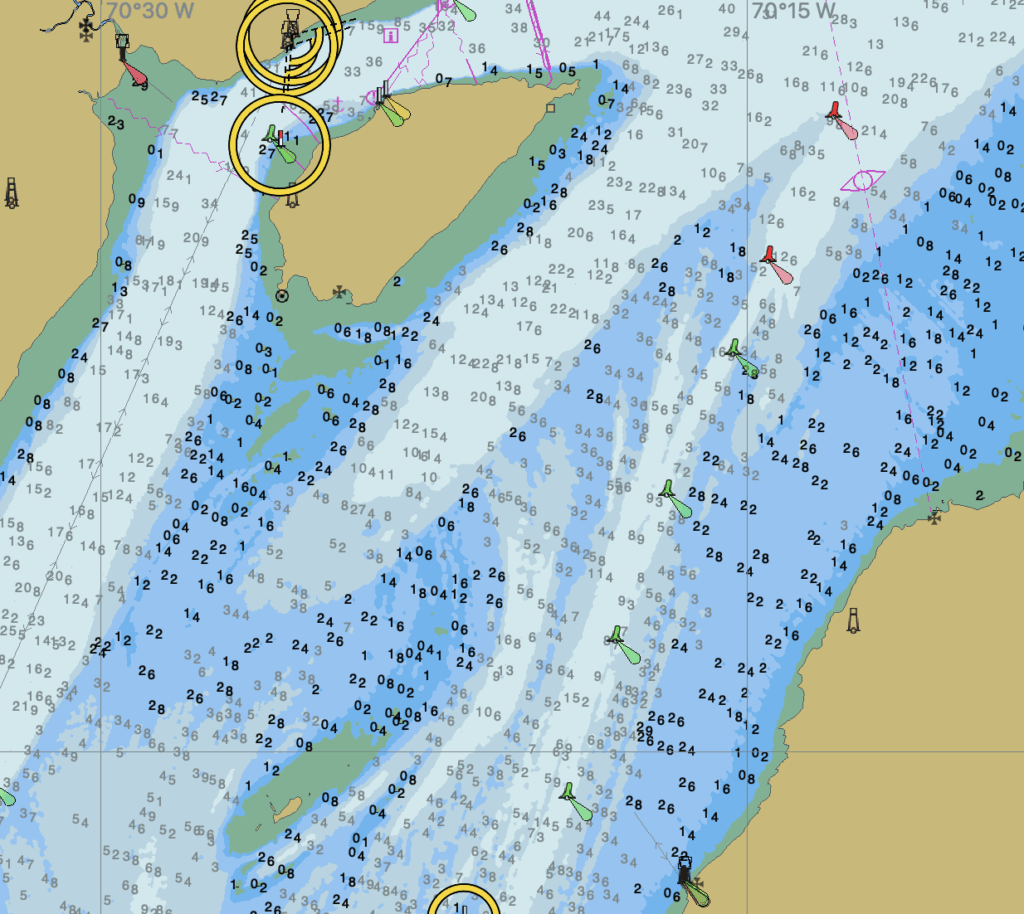
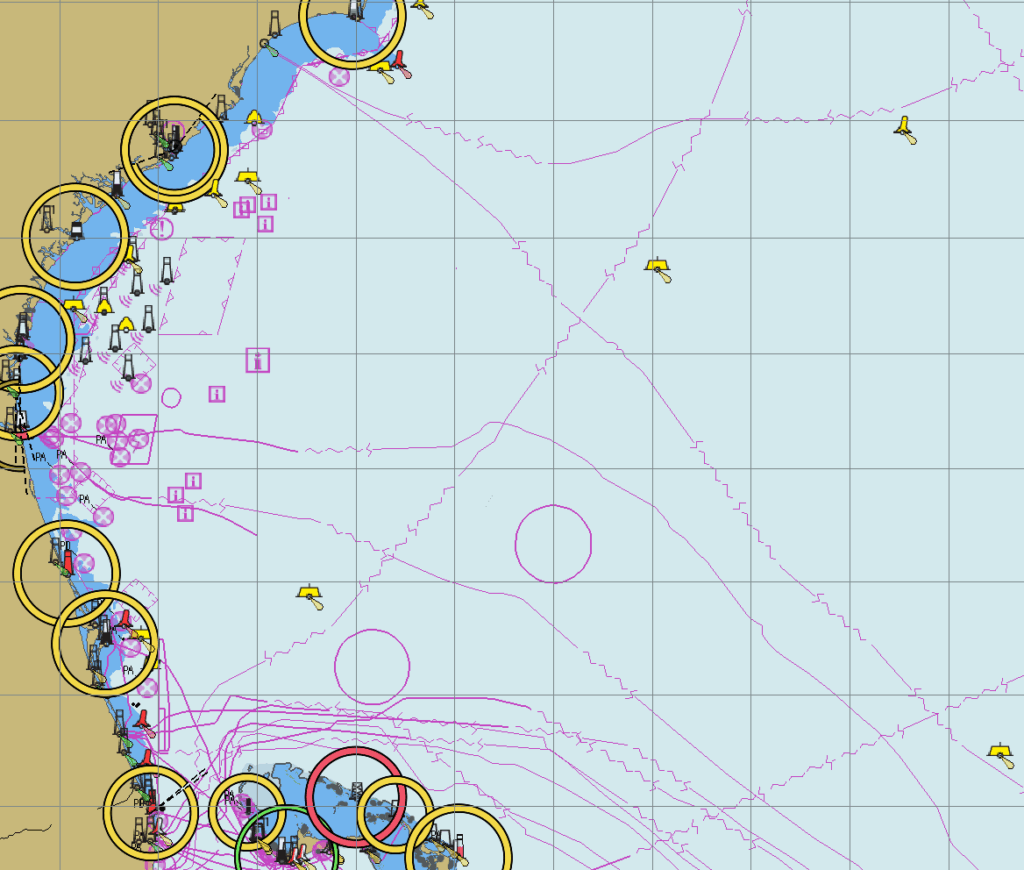
Once the charts have been purchased and installed, they can be viewed in OpenCPN. The image at the beginning of the text shows an extract from map 1233.
Reading map symbols
To obtain information about a symbol on a map, simply double-click on the symbol. A pop-up window will then detail the information available for the identified object. The image below shows the example of buoy H93, a side buoy in the South Channel of the St. Lawrence River.
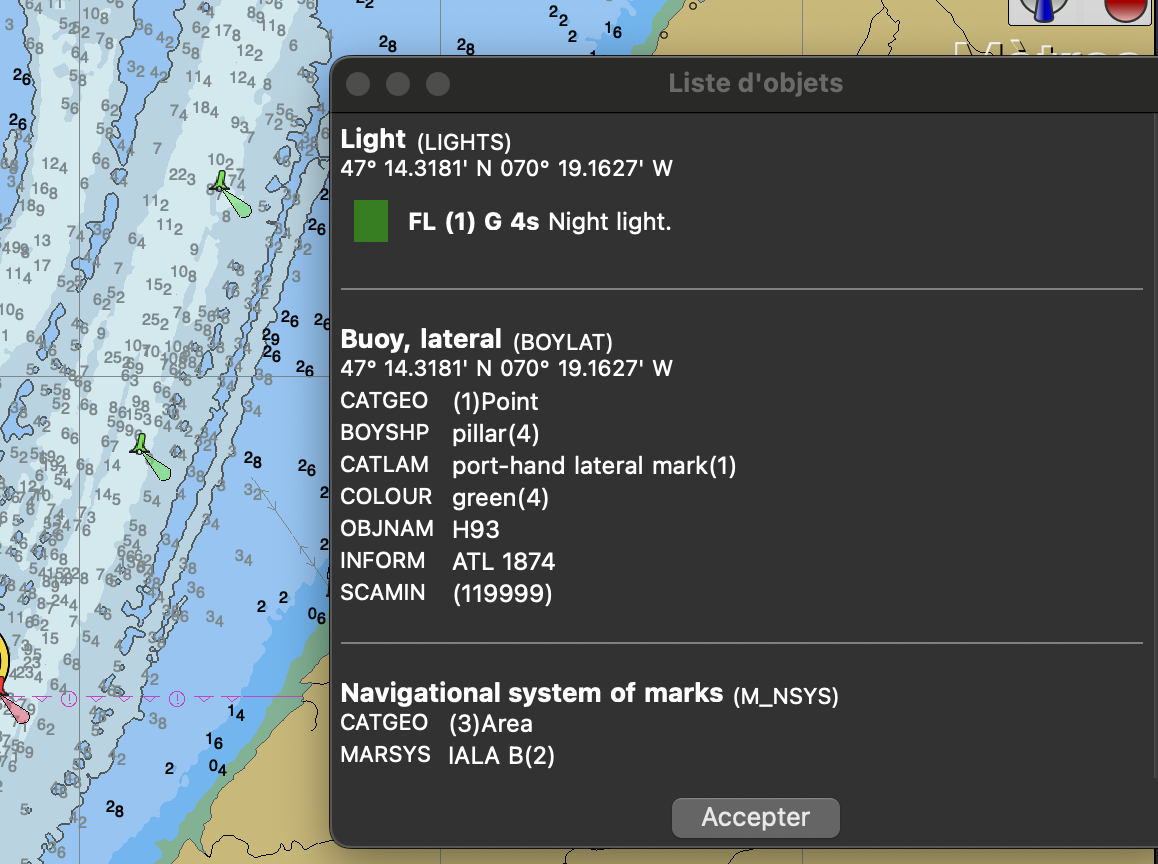
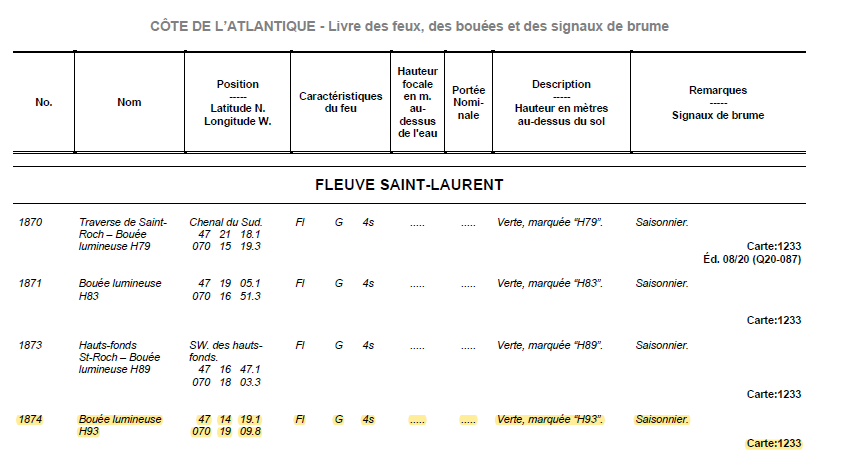
The Coast Guard’s Book of Lights, Buoys and Fog Signals shows that most of the information is contained in the pop-up window, but not all the details. A comparison with the extract below shows that the electronic chart does not indicate that the buoy is seasonal.
Measuring distances and angles
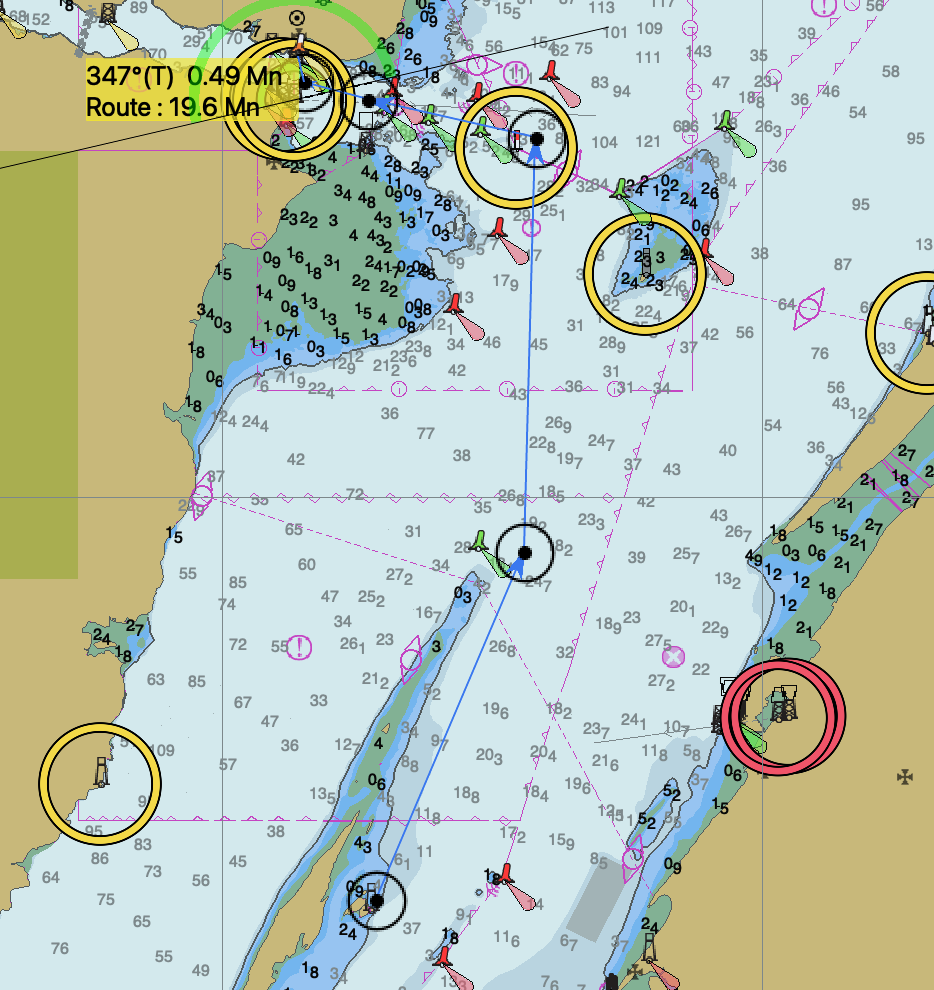
To measure angles and distances, use the “m” key on the keyboard. The mouse cursor should then turn into a pencil, and you simply click at successive points to obtain the cumulative distance and bearing, in true degrees, of each segment. Below, I illustrate the idea of a road between Brandy Pot and Tadoussac. It shows an approximate distance of 19.6 nautical miles (Mn), and the last bearing to Tadoussac Bay is 347 degrees true (° T).
To exit measurement mode, press the escape key on your keyboard.
Learn about currents and tides
(Note: this section reproduces part of the text on tidal calculations)
As long as the charts you buy have information on currents and tides, OpenCPN will make it available. On OpenCPN, Canadian charts include tidal information.
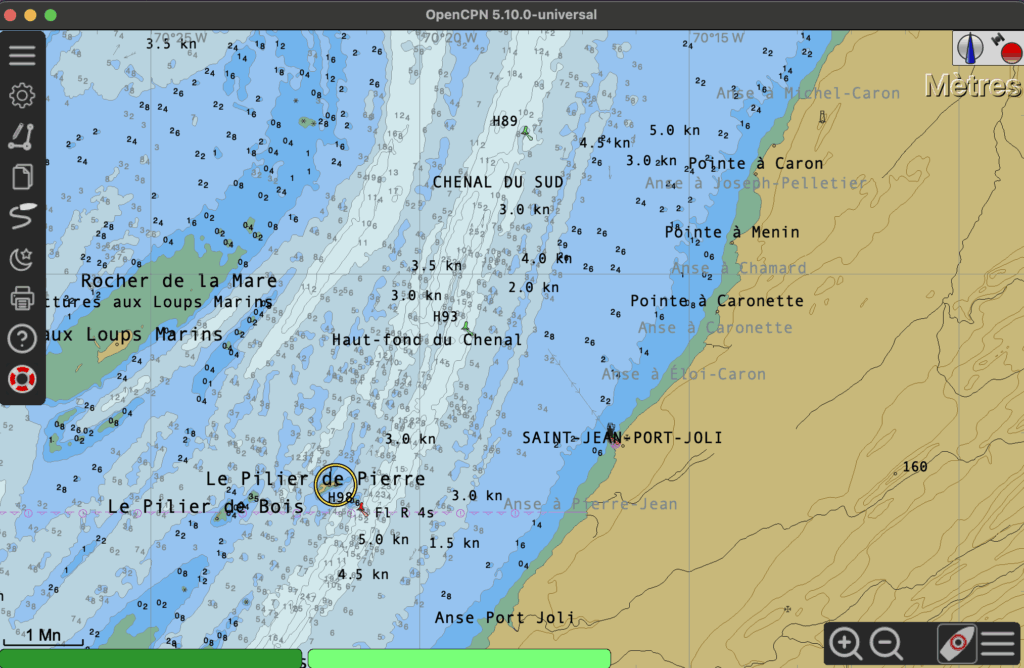
The first step is to identify the region of interest. I illustrate below the Saint-Jean-Port-Joli marina, which requires to dock within a two hours window around high tide. I explore tides on August 1st, 2025.
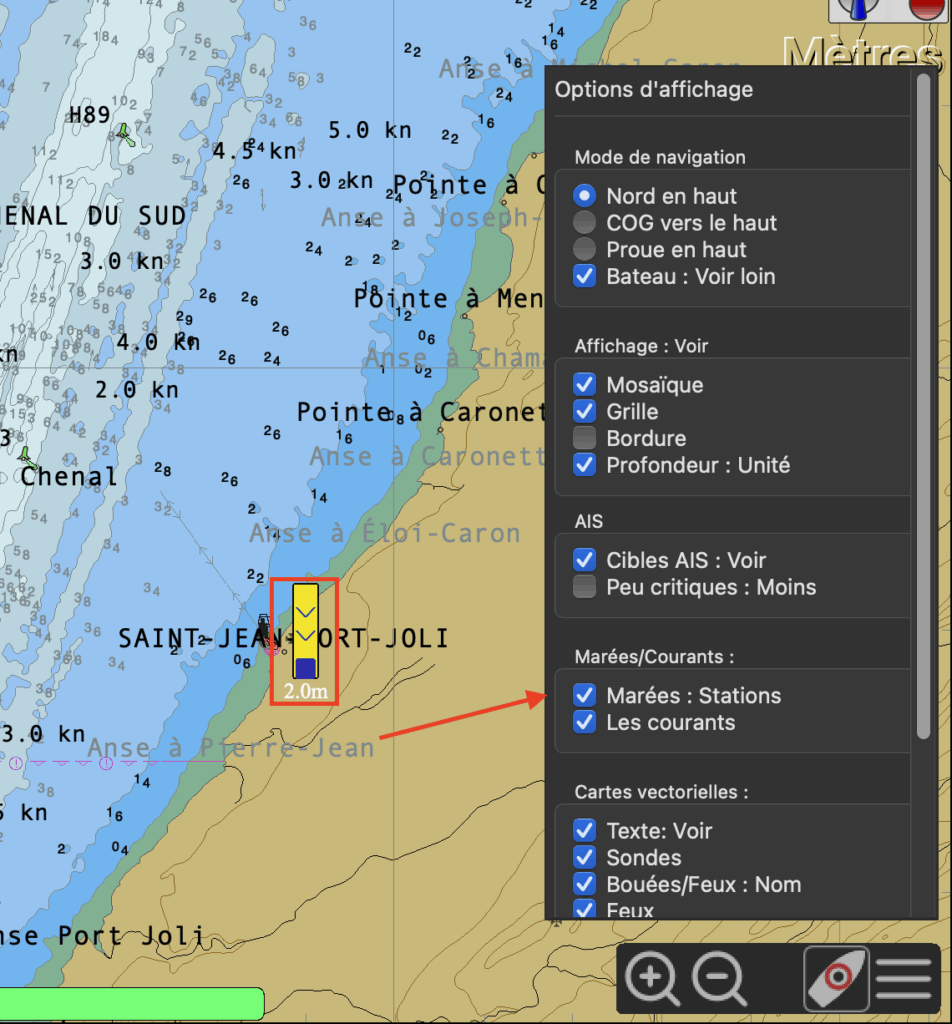
In the display configuration menu (bottom right), click on the “Tide stations” option (see image below). Clicking on the option should then cause small yellow rectangles to appear, each indicating the water level at each tide station. As OpenCPN derives its data from Fisheries and Oceans Canada, the stations display the same information as the tides.gc.ca website.
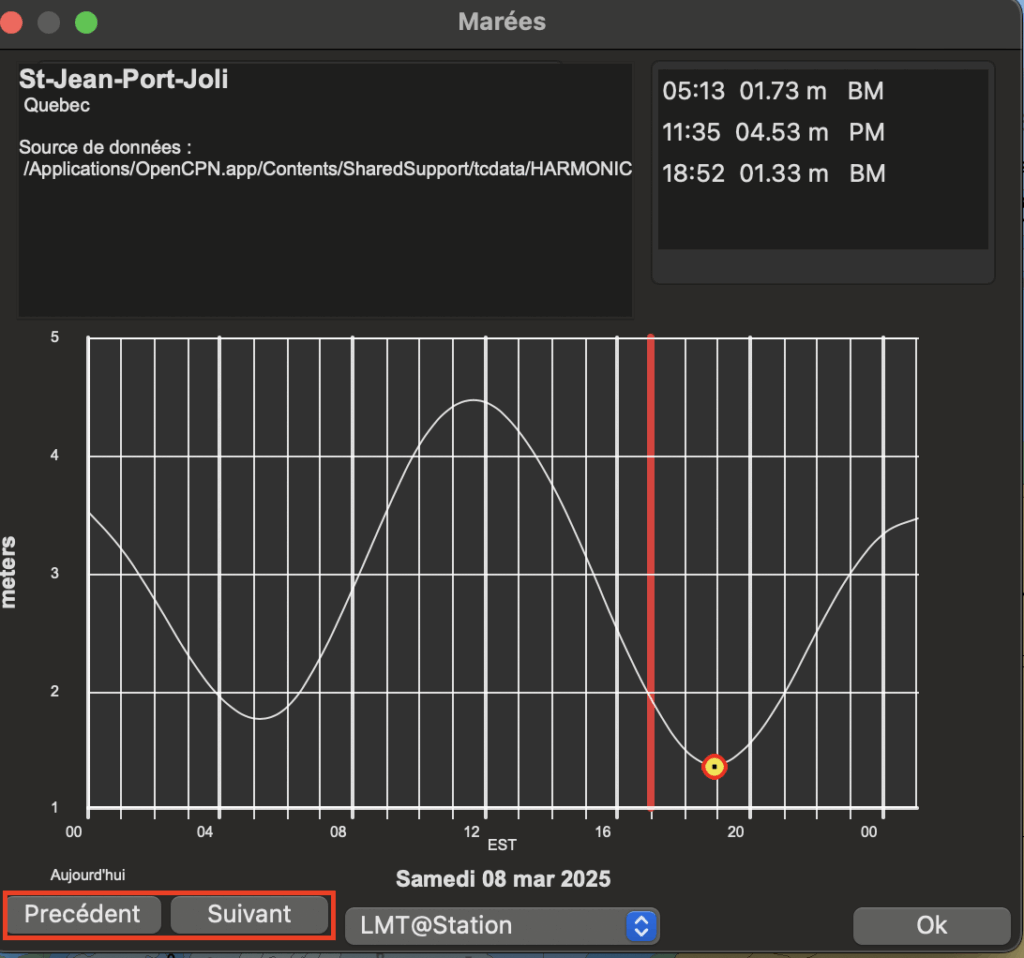
Once the stations are displayed, right-click on the station of interest (here, Saint-Jean-Port-Joli) to display the tides pop-up window. The software is quite temperamental: you may have to click more than once. You should then be able to see the window shown on the right. The look may vary from one brand of operating system to another. The image below is taken from an Apple. In any case, you should recognize the sine curve representing the tide level.
To move to the date of interest, use the “previous” and “next” buttons at the bottom of the window. If the date you’re interested in is fairly far in the future, you’ll need to be patient and click several times.
Once you’ve selected the day, a small information box at top left gives the time and level of high tides (“pleine mer”: PM) and low tides (“basse mer”: BM). By default, the information is given in local mean time (LMT), i.e. the time determined by the longitude difference from the Greenwhich Meridian.
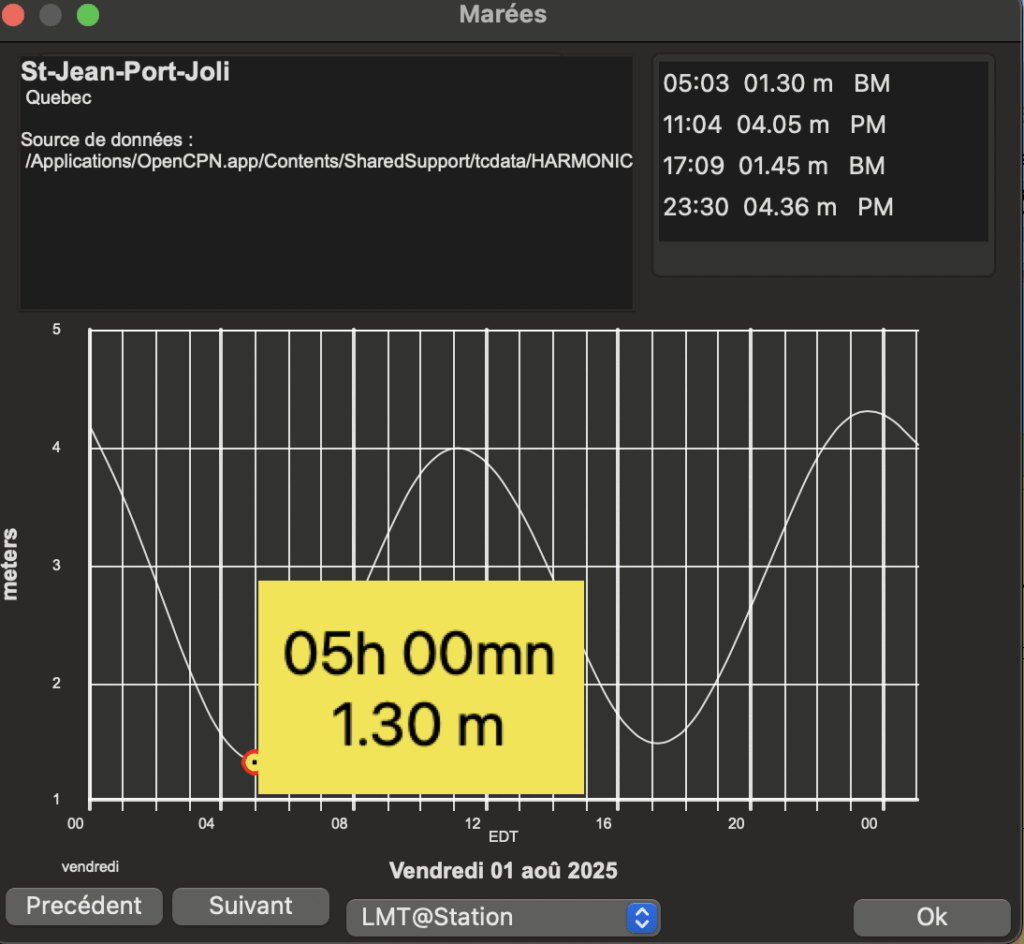
Once the low tides have been identified, the appropriate tidal window can be found by adding two hours to the first low tide (05:03 – 2 hours) and subtracting two hours from the second low tide (17:09 – 2 hours). The acceptable window for arrival is therefore between 07:03 in the morning and 15:09 in the afternoon (in ” local mean time “).
Evaluating speed and course over the bottom
My desktop computer has no built-in GPS. As a result, I’m unable to show OpenCPN’s performance in terms of speed and course over ground.
Planning and executing routes
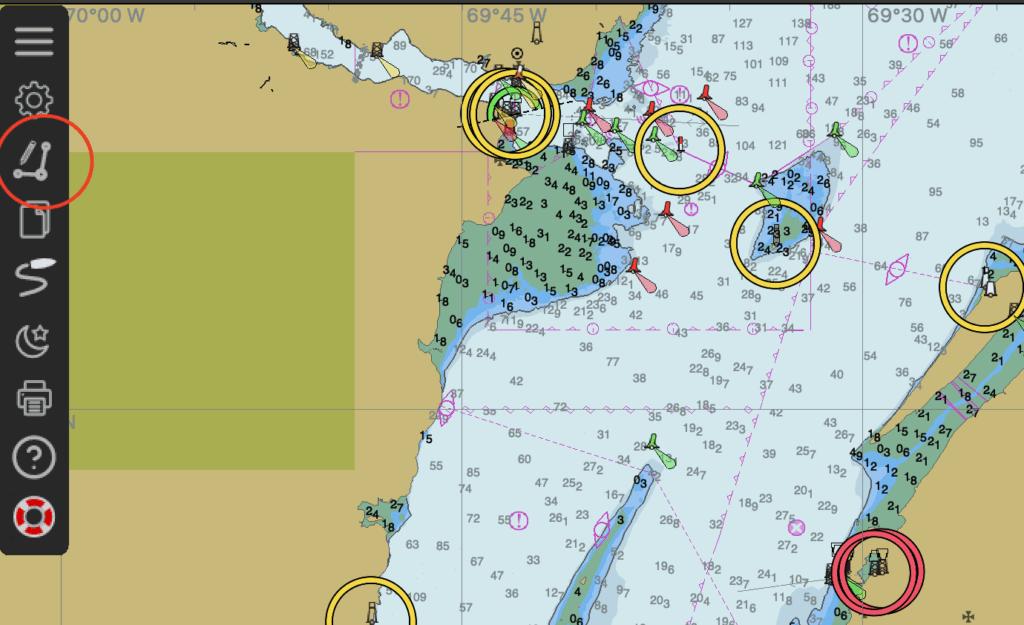
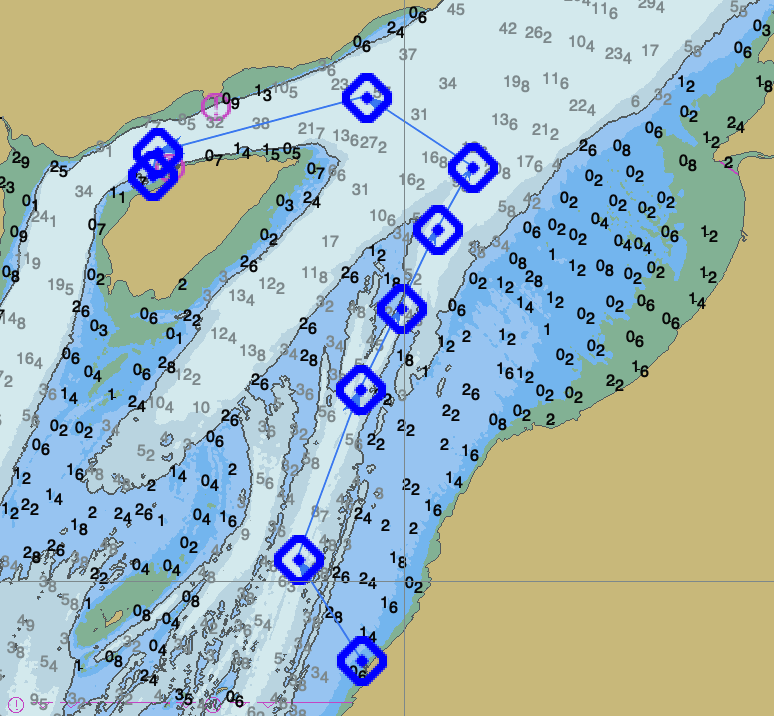
Route planning is performed via the “Routes: create” menu in the main software window (image above). The cursor becomes a pencil, and you simply point and click to create a route made up of successive segments. Below is an example of a route between Saint-Jean-Port-Joli and the Ile-aux-Coudres anchorage. Once the route has been created, you can either activate it to enter “navigation” mode, or save it for later use (or export).
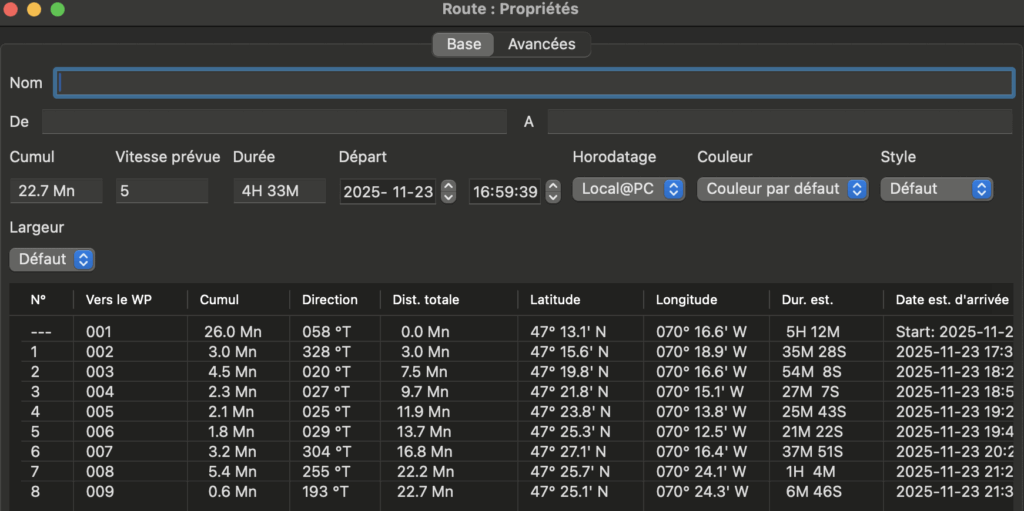
Once the route has been created, you can right-click on it to retrieve its properties. You’ll then see the succession ofwaypoints, the expected duration of the route, and other information typical of route planning. In particular, you can give the route a name so that it can be saved. This is useful if you’re writing several new routes. After a few seasons, the default name “Unnamed route” is much less meaningful than a name describing the route!
Exchanging planned routes
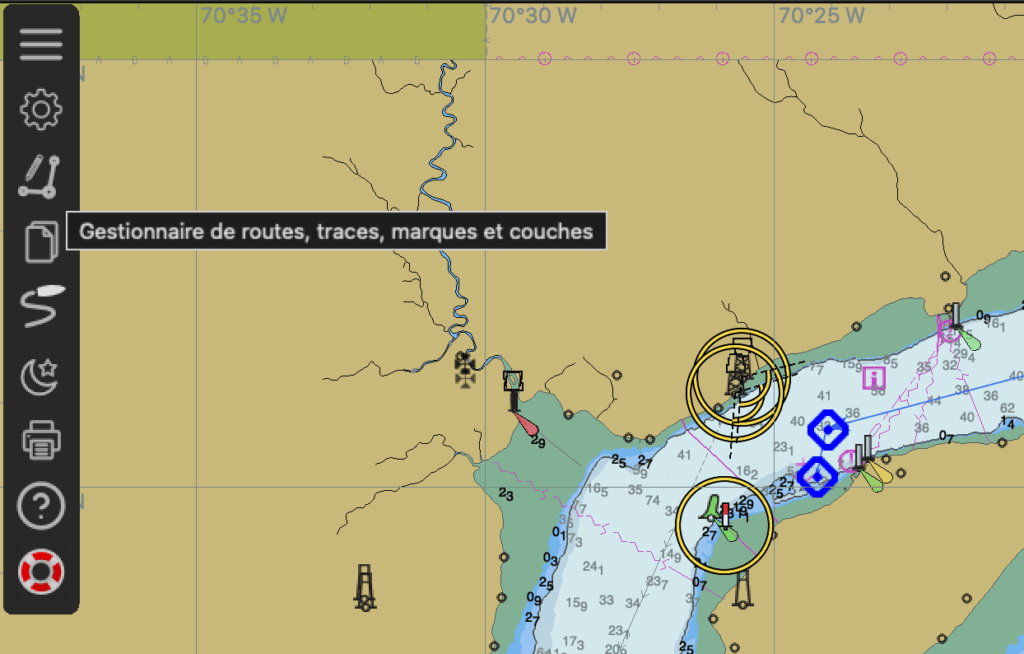
To exchange saved routes, click on the “Route manager” menu in the application’s main menu (image above). Clicking on it takes you to all the routes saved in OpenCPN (image below).
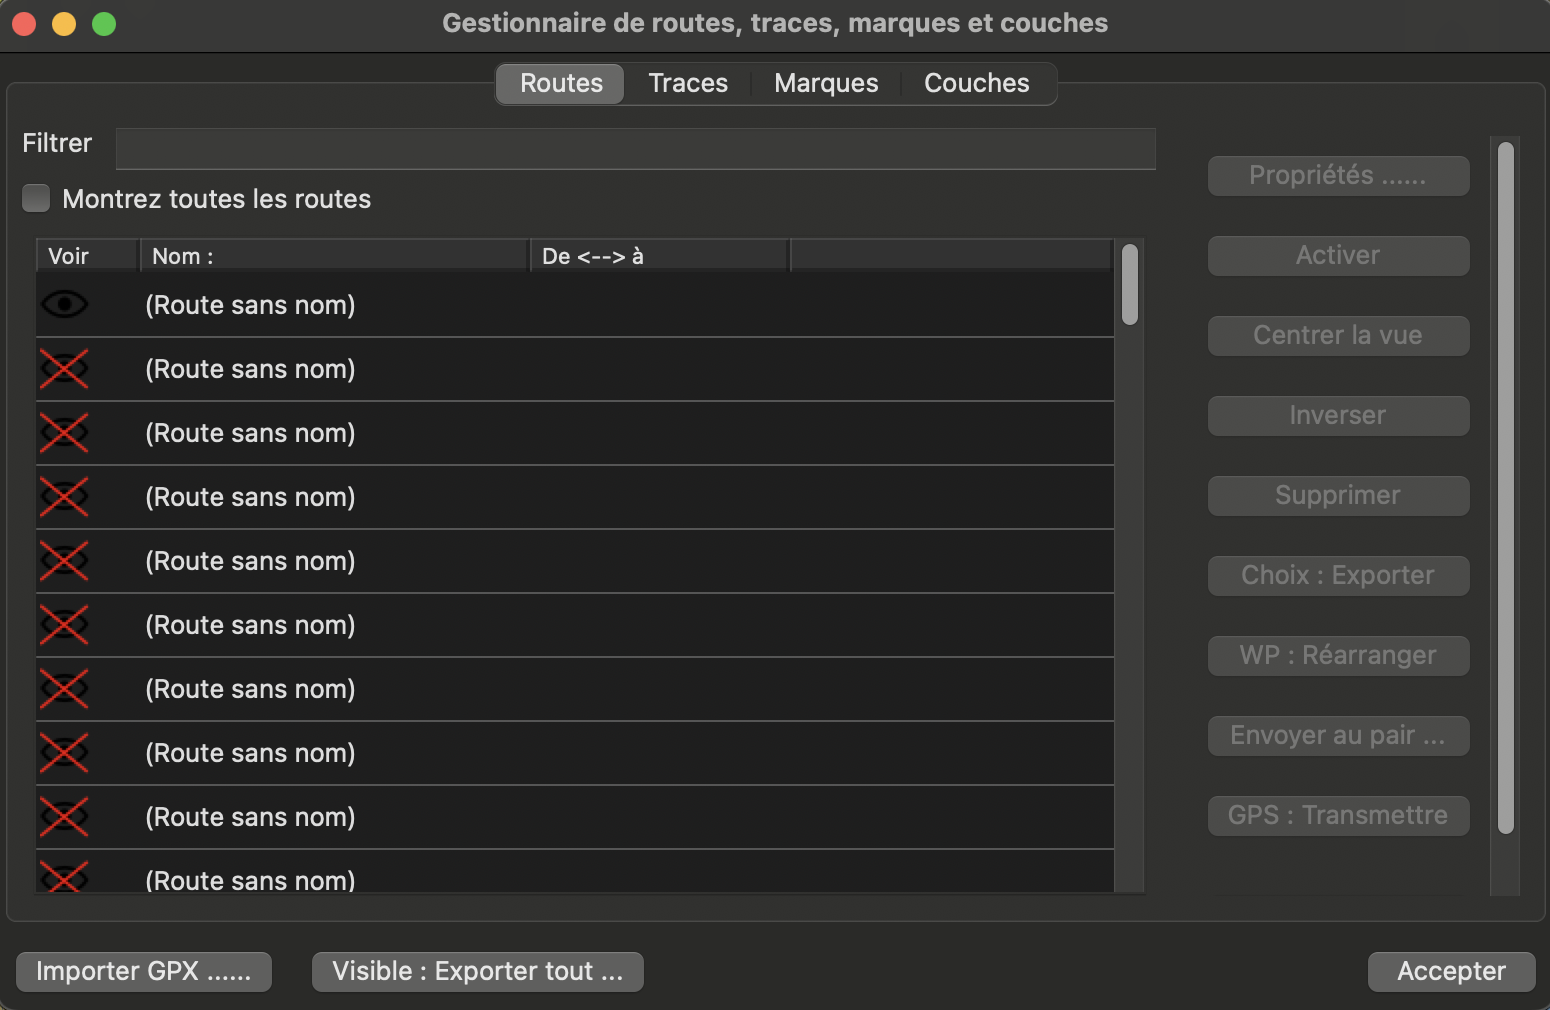
Simply select a route and click on the “Select: Export” button. OpenCPN will then create a route in .gpx format, an open format that can be read by a large number of chart applications. Note also that the Route Manager lets you import routes in .GPX format using the button at the bottom left of the screen.
Record the actual route taken
My desktop computer has no built-in GPS. As a result, I’m unable to show OpenCPN’s route-following performance. Eventually, I may get myself a gps puck.
Conclusion
OpenCPN is an application I often use to plan passages. It works well on my desktop computer. The route editing and adjustment capabilities make it a good application for setting routes.
My tests on an Android tablet were mixed: during use, the application had difficulty connecting to the tablet’s GPS. That said, sharing a route planned on the computer to another navigation app installed on my phone has become a routine for me.
An undeniable advantage for the curious: you can try it out for free using American charts. So you can experiment and see if it is to your liking!
7 Responses
[…] examples, this site includes five introductions to different applications: Navionics (Boating), OpenCPN, C-MAP, Savvy Navvy and SEAiq. Below, I detail the elements common to navigation applications […]
[…] first text covers the Navionics (Boating) application. The other texts cover OpenCPN, Savyy Navy, C-MAP and SEAIQ respectively. Prior to reading this text, it is a good idea to reat […]
[…] navigation applications. It focuses on the C-MAP application. The other texts cover the use of OpenCPN, Savy Navy, Navionics and SEAIQ. It focuses mainly on installations on tablets or cellular devices […]
[…] other texts cover the Navionics (Boating), C-MAP, OpenCPN and SEAIQ applications respectively. This text assumes that the application is installed on a […]
[…] manière similaire à OpenCPN, l’achat de cartes électroniques passe par un menu interne à l’application et, dans […]
[…] a similar way to OpenCPN, electronic charts can be purchased within the application and, in the case of paid charts, by […]
[…] texts describing the use of the electronic navigation applications: Navionics (Boating), C-MAP, OpenCPN, Savvy Navvy and SeaIQ. Each text examines hot to perform eight essential navigation […]