Navigation is about figuring out where you are and where you’re going in order to reach your destination. Specifically, coastal navigation involves using the landmarks of the coast to navigate. This discipline is practiced by planning routes, evaluating them, validating your position and speed in real time, and making adjustments to the route when necessary.
Navigation requires basic elements of mathematics that are not very complicated. Sometimes these are calculations (like distance calculations), sometimes they are concepts that need to be mastered (like coordinate systems). For those less accustomed, these concepts can take time to master, giving the impression that navigation is all about learning them.
That said, the more comfortable you become with arithmetic, the more you can concentrate on what navigation is all about: thinking about position, about the route to take, about risks, and the pros and cons of alternative routes. To use an analogy, calculations are to navigation what strides are to hiking. The fitter you are, the less you concentrate on your steps and the more you focus on the landscape, the obstacles and the path ahead.
Practice makes perfect. Below, I detail the eight most important concepts. Mastering them is essential for all introductory coastal navigation certificates. In particular, they are required for the Royal Yachting Association‘s Day Skipper, Sailing Canada’s Basic Coastal Navigation and Transport Canada’s Charting and Piloting exams. Beyond the certificates and exams, you need to master them in practice.
There are associated exercises. For novices, a good tip is to do the exercises slowly, concentrating on your ability to get them right first time. Take as much time as you need. There’s more than one way to get the right answer, and work with the method that feels most natural to you. These fundamentals are part of the foundation that will enable you to navigate safely. Eventually, these calculations will become routine… and second nature.
1. Converting minutes and hours
Calculating speeds and durations sooner or later requires you to convert decimal time measurements into hours, minutes and seconds. For example, expressing a duration of 5.33 hours in hours and minutes. Or expressing 7.82 days in days and hours. The fractional part, i.e. numbers after the decimal point, must be converted into smaller units. In this way, we want to determine what 0.33 hours represent in minutes and what 0.82 days represent in hours.
Converting these numbers makes them more intelligible. It’s easier to understand what you have to do if you have to “plan an 8-hour sail” rather than one lasting “28 800 seconds”. But they’re the same length!
To help with these conversion calculations, it is not forbidden to use Google if you have access to the Internet. Eventually, you need to be able to do these conversions yourself.
| There are… | |
| 24 hours | in a day. |
| 60 minutes | in an hour. |
| 60 seconds | in a minute. |
To convert, multiply the fractional part by the number of units in the time measure of interest. So, to convert the fractional part of 5.33 hours into minutes, we need to multiply 0.33 by 60, because there are 60 minutes in an hour.
First example
For a sailing time of 5.33 hours, the fraction after the decimal point is 0.33. This part must be multiplied by 60. Using a calculator gives 0.33 x 60 = 19.8, or 19.8 minutes. This can be rounded up to twenty minutes. A duration of 5.33 hours is therefore equivalent to 5 hours 20 minutes.
Note that the number of minutes calculated also includes a fractional part (the “0.8” of 18.8), so we could also multiply this 0.8 by 60 to obtain the number of seconds (0.8 x 60 = 48 seconds). An unrounded answer would therefore be 5 hours, 19 minutes and 48 seconds. That said, no navigation plan needs that much precision.
Second example
For a sailing time of 7.82 days, the fractional part is 0.82. As there are 24 hours in a day, we need to multiply 0.82 by 24, which gives 19.68 hours. Alternatively, round up to 7 days and 20 hours. (If we continue converting the fractional part, we’ll find 7 days, 19 hours, 40 minutes and 48 seconds).
Backwards…
You also need to be able to do the opposite. For example, if you’re traveling at 15 kilometers/hour for 3 hours and 22 minutes, you need to know which fraction of an hour corresponds to the 22 minutes. Similarly, if you travel for 7 days and 18 hours, you’ll need the fractional part of the number of days. You need to be able to do the reverse operation to obtain a fractional part.
To do this, simply divide the number of minutes by 60 and add it to the whole number of hours. For days, divide the number of hours by 24 and add to the whole number of days.
Third example
If we sail for 3 hours and 22 minutes, what is the sailing time in hours?
Solution: We divide the 22 minutes by 60 to obtain 0.37 hours. Adding to the whole number gives a total of 3.37 hours.
Fourth example
If we sail for 7 days and 18 hours, how many days – including the decimal part – have passed?
Solution: Divide the 18 hours by 24 to obtain 0.75. Then add to the whole number of days to get 7.75 days.
Exercises and solutions
Convert the following numbers to the appropriate format: hours and minutes, days and hours or minutes and seconds.
- 22.35 hours. (Solution: 22 hours, 21 minutes).
- 18.25 hours. (Solution: 18 hours, 15 minutes).
- 16.44 minutes (16 minutes, 26 seconds).
- 1.19 days (1 day, 5 hours).
- 2.21 day (2 days, 5 hours).
Convert the following durations into their decimal representation:
- 18 hours, 25 minutes (Solution: 18.42 hours).
- 47 minutes, 29 seconds (Solution: 47.48 minutes).
- 3 days, 8 hours (Solution: 3.33 days).
- 6 hours and 12 minutes (Solution: 6.2 hours).
- 4 minutes and 18 seconds (Solution: 4.3 minutes).
2. Angles
An angle is a measure of the opening between two straight lines. Angles are measured in degrees (°), and an angle measurement ranges from 0° to 360°.
In navigation, angles are generally used to measure three things:
- The ship’s direction in relation to North. This is called heading or course, depending on the context. In this case, the first line is a vertical line (on a chart, North is at the top) and the second is a line representing the ship’s direction. By convention, the angle is measured from the horizontal line (North).
- The direction of an object in relation to North. This is called a survey. The angle is measured from the vertical line.
- The direction of an object in relation to the direction of the ship. This is called a bearing. In this case, the first line is the ship’s axis and the second line is the line between the object and the ship. By convention, the angle is measured from the ship’s axis.
To measure angles on a chart, you need a protractor. You can use a protractor similar to the one you use at school, but it’s better to use a Breton protractor (below), which makes it much easier to measure angles greater than 180°.
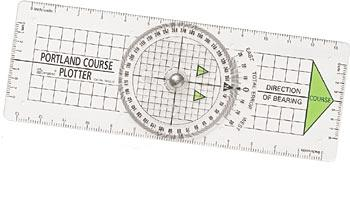

On an electronic application, the protractors will be integrated into the application and the application will do the measuring for you.
First example
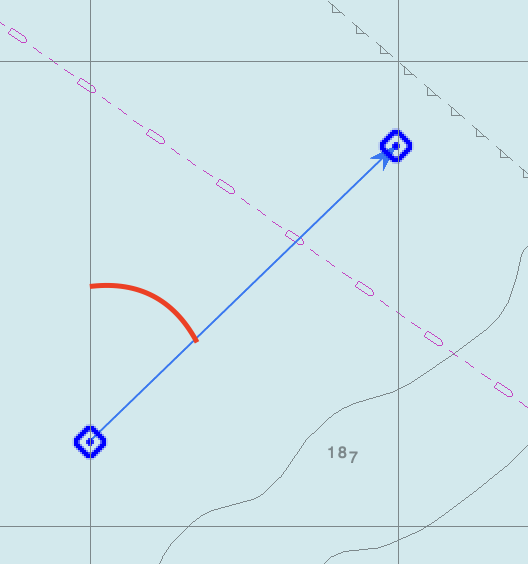
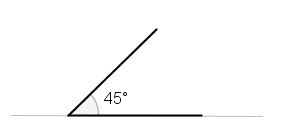
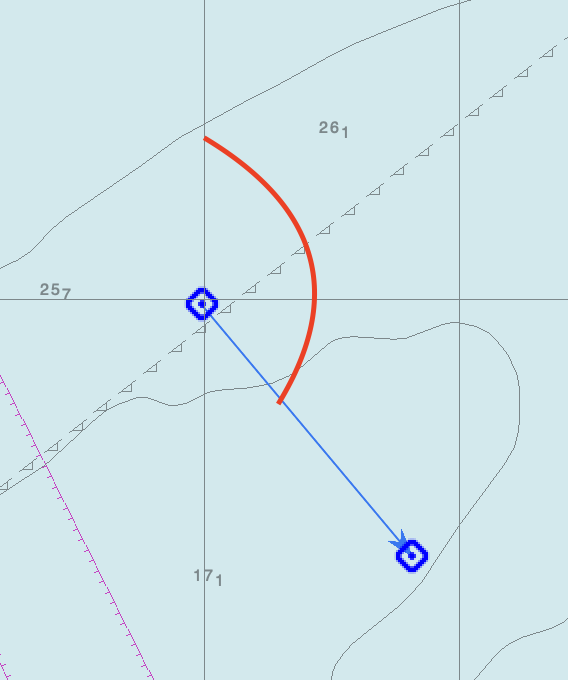
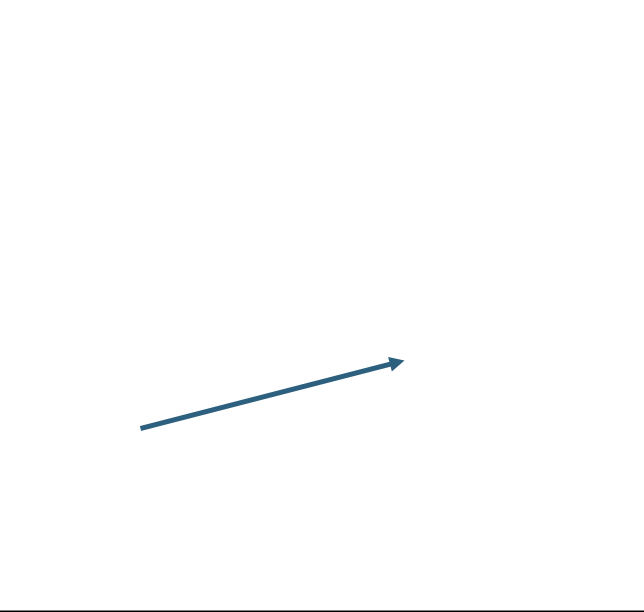
In the image on the left, identify the angle between the vertical line on the left (in black) and the blue arrow. The angle is shown in red.
Solution: take a protractor, set the reference to zero on the horizontal axis, then measure the number of degrees indicated where the blue arrow passes. In this case, you should be able to read 45°. (Print this page if necessary.)
This 45° angle corresponds to the North-East (NE) direction on a map.
Second example
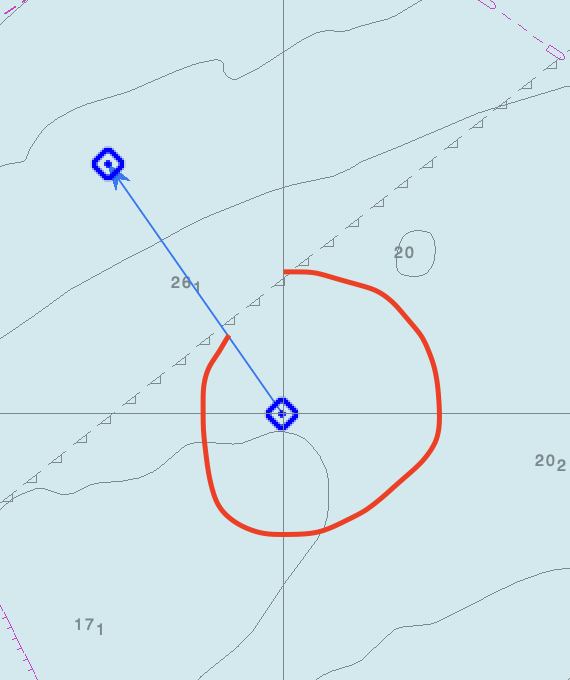
In the image on the right, identify the angle between the vertical line in the center of the screen and the blue arrow. The angle is shown in red.
Solution: Same procedure. Take the protractor, set the reference to 0°, then read the number of degrees to be associated with the point where the blue arrow arrives. It should read 220°.
This direction corresponds roughly to the south-west on a map (the “true” south-west is at 225°).
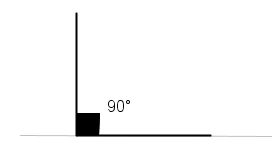
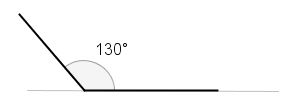
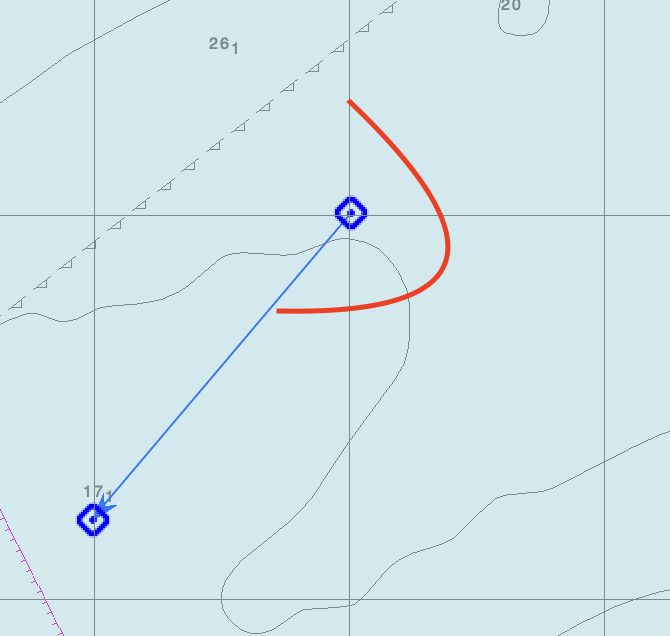
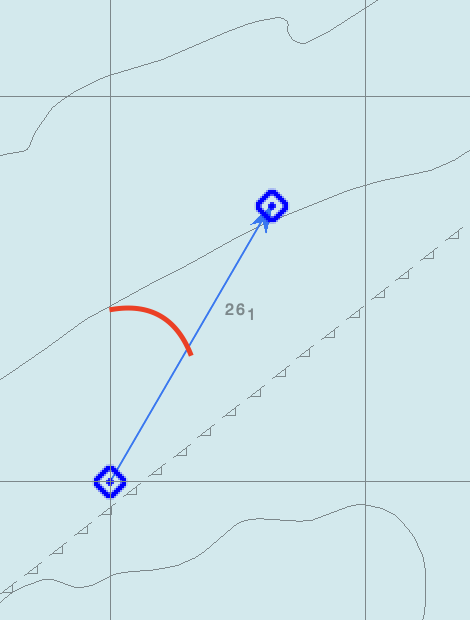
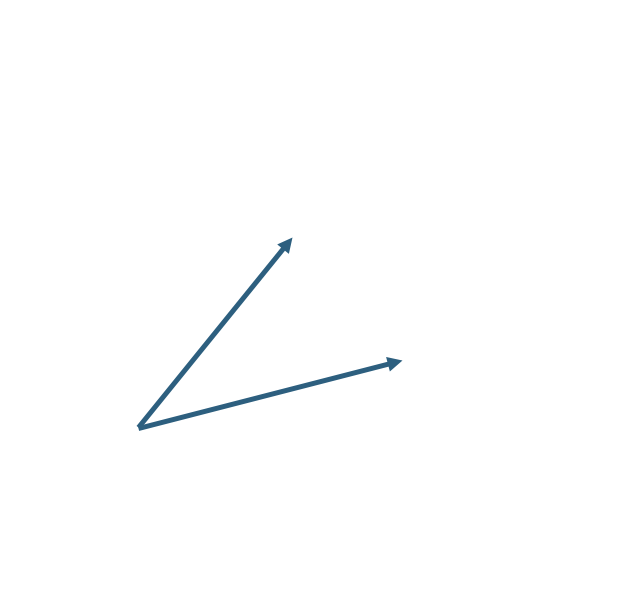
Exercises
Measure the three angles shown in the images below.
3. A coordinate system
A coordinate system is a convention for designating a position. For a positioning system on earth, it comprises three elements:
- A reference point from which positions are measured.
- Two axes, starting from the reference point, each designating a direction in which the coordinates increase.
- Two scales, one for each axis, which indicate the point at which the coordinate increases.
I’m presenting here two coordinate systems for navigation, but there are many others that we can learn over time.
The Earth’s geographic reference system
The Geographic Datum of the Earth is the international convention used to express positions on the globe.
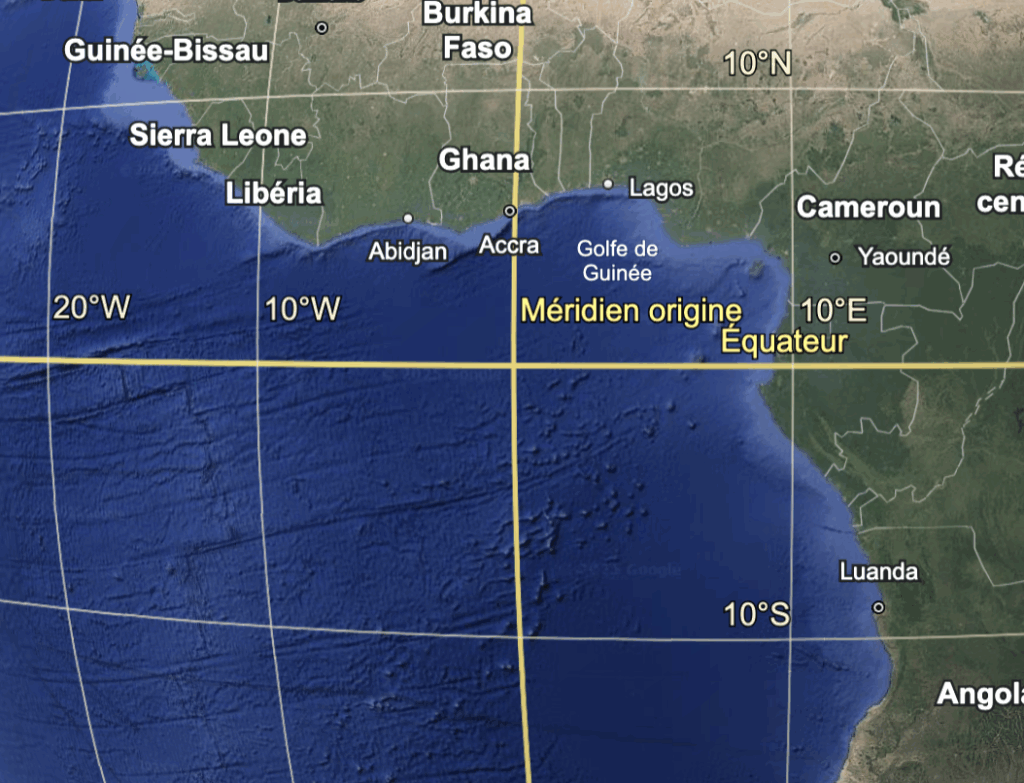
The reference point of the earth system is the intersection between the equator and the Prime Meridian. This point is somewhere in southern Africa (image below).

The two axes of this coordinate system correspond to Latitude and Longitude.
Latitude is an angle between 0° and 90°, and designates the elevation of a position in relation to the equator. When this elevation is towards the North Pole, we speak of a North Latitude. When this elevation is towards the South Pole, we speak of South latitude. Thus, a position at 30° N (“at the top” of the equator) does not designate the same place as at 30° South (“at the bottom” of the equator).
Longitude is an angle between 0° and 180°, and measures the distance from the Prime Meridian, i.e. the meridian through which the Greenwich Observatory passes. For historical reasons, the First Meridian is sometimes called the Greenwich Meridian (pronounced “Green-itch”). When moving west of the prime meridian, the coordinate is marked with a W (for “West”). When moving east of Greenwich, the coordinate is marked with an E (for “East”). Thus, the 22° W coordinate does not designate the same location as the 22° E coordinate.
A complete coordinate then designates a position in terms of latitude and longitude. The convention is to designate latitude first, then longitude. For example, Quebec City is located (approximately) at 46.8105004° N, 071.2493283° W. Similarly, 33.9088006° S, 150.8694066° E is the approximate position of Sydney, Australia.
Latitude and longitude are crucial to navigation. They are the basis of all nautical charts and electronic positioning applications.
First example
Using Google Maps, identify the city at position 48.7961197° N, 002.4172945° W.
Solution: it’s the city of Paris (France).
Second example
Using Google Maps, identify the coordinates of the city of London (in the UK).
Solution: It’s approximately 51.4302525° N, 0.6323589° W.
The Cartesian coordinate system
The Cartesian coordinate system is a “generic” system that we learn in kindergarten. It is used first and foremost for quick sketches and intermediate calculations, which are then transferred to a map. Many examples of navigation books use the Cartesian system.
Its two axes are the “x-axis”, designating the “left-right” dimension, and the “y-axis”, designating the “up-down” dimension. Graduations are in any units (meters, kilometers, centimeters, as required). The convention is that as you move to the left of the reference point, the x-axis graduation increases. Similarly, the y-axis increases as you move up.
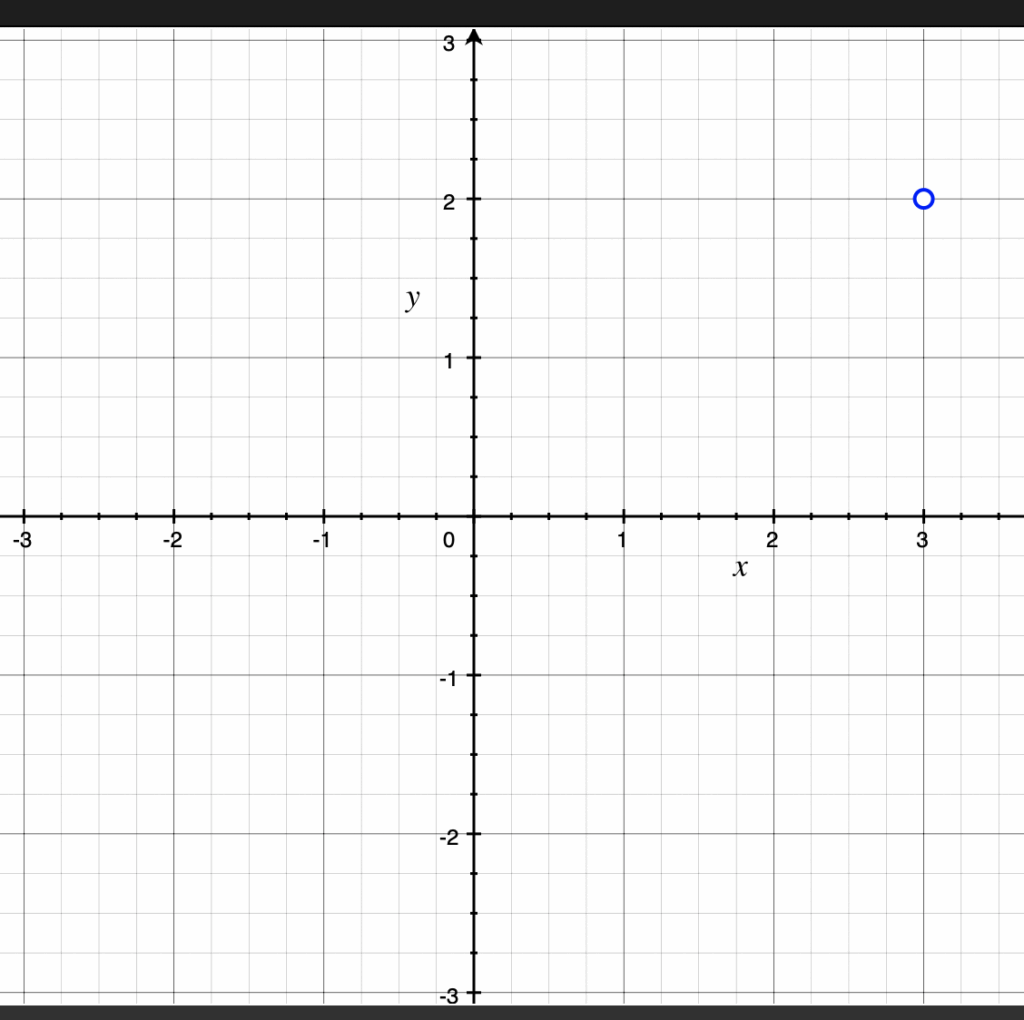
A picture is worth a thousand words.
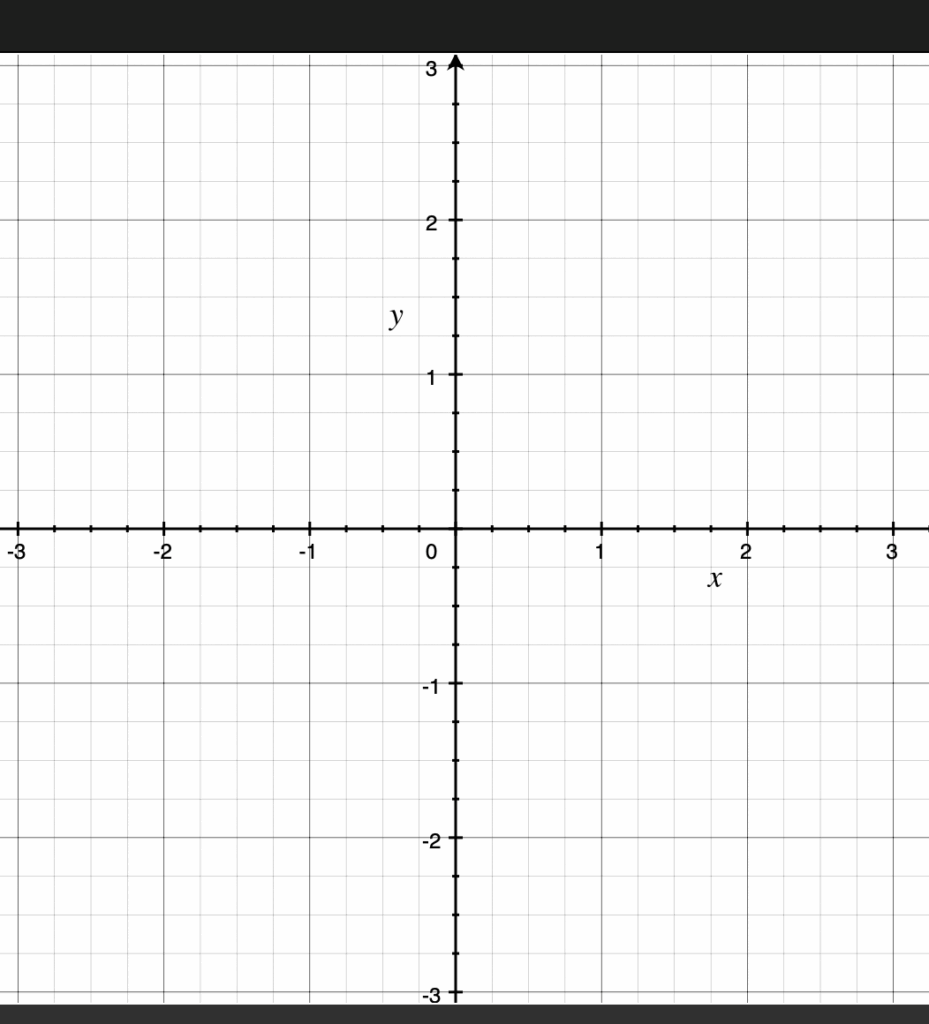
A coordinate in the Cartesian system therefore comprises two numbers. The convention is to designate the x-number first, then the y-number. For example, the position (3, 2) designates three units in x to the left, then two units in y upwards (image below).
First example
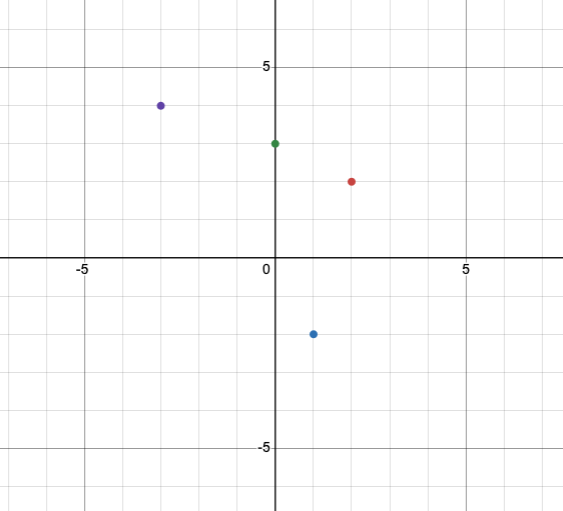
In a Cartesian coordinate system, identify the positions (3,0), (1,2), (-1,3), (-1,-2).
Solution: the solution can be seen at this address and in the image below.
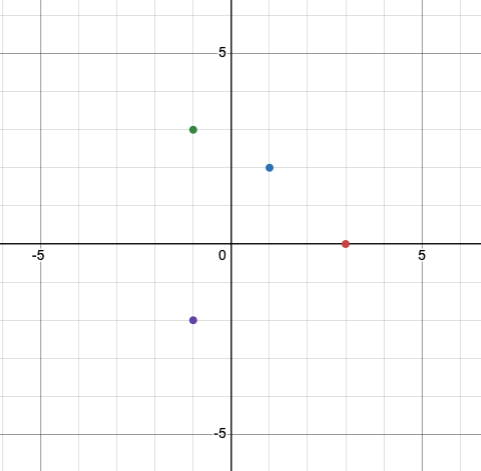
Second example
Identify the coordinates of each point in the generic coordinate system in the image below.
Solution: the red point is (2,2), the blue point is (1,-2), the green point is (0,3) and the purple point is (-3,4).
Exercises
Using Google Maps, identify the coordinates of the cities below.
| City | Solution |
| Matane | 48.8265056° N, 067.6063794° W |
| Sept-Îles | 50.1811805° N, 066.4260822° W |
| Gatineau | 45.4643076° N, 075.7599674° W |
In a Cartesian coordinate system, identify the following points (10, 10), (2, 18), (-3, -3) and (-4, 2).
The solution is here.
4. Converting minutes to degrees
Navigation coordinates are expressed in degrees (°), minutes (‘) and seconds (”). For example, Quebec City is at coordinates 46° 48′ 37.8” N, 071° 14′ 57.58” W. The term 46° 48′ 37.8” N refers to 46 degrees (46°), 48 minutes (48′) and 37.8 seconds (37.8”) North (N). The second term (071° 14′ 57.58” W) means 71 degrees (071°), 14 minutes (14”) and 57.58 seconds (57.58”) West (W).
This is the same idea as for the time measurements discussed in section 1: you need to be able to convert degrees, minutes and seconds into degrees with a fractional part (with numbers near the decimal point). You also need to be able to do the opposite. Convert fractional coordinates into degrees, minutes and seconds. If you’re just starting out, you can get help from an online conversion system, but eventually you’ll need to be able to do it yourself.
| There are… | |
| 60 minutes | in a degree (1°). |
| 60 seconds | in a minute (1′). |
The conversions are the same as for time. The only difference is that the conversion is from degrees to minutes (instead of hours to minutes).
First example
The position of Gaspé is approximately 48.8275383 N, 64.4878066 W. Convert these coordinates into degrees, minutes and seconds.
Solution: For the North component, there are 48 whole degrees and a scale of 0.8275383. Multiply this number by 60 to obtain the number of minutes, i.e. 49.652 minutes. The integer part is 49 minutes (49′), leaving 0.652 to be converted into seconds. Multiply the remainder by 60 to obtain 39.12 seconds (39.12”). The coordinate expressed in degrees, minutes and seconds is therefore 48° 49′ 39.12” N.
For the western component, we do the same thing. There are 64 whole degrees (064°) and a scale of 0.4878066, which must be multiplied by 60. The result is 29,268 minutes. We retain the integer part (29′) and to obtain the number of seconds, we multiply the scale (0.268) by 60. This gives us 16.08 seconds (16.08”). In this way, the western component is 064° 29′ 16.08” West.
Second example
The town of Tadoussac is at coordinates 48.1441881 N, 69.7077253 W. Convert these coordinates into degrees, minutes and seconds.
Solution:
- North component: There is 48°, with a remainder of 0.1441881.
- Multiplying this remainder by 60 gives 8.6513 minutes. We retain the integer part (8′).
- Multiply the remainder (0.6513) by 60 to obtain the number of seconds. The result is 39.08 seconds (39.08”).
- Western component: There is 69°, with a remainder of 0.7077253.
- Multiplying by 60 gives 42.464 minutes. We retain the integer part (42′).
- Multiplying the remainder (0.464) by 60 gives 27.81 seconds (27.81”).
Tadoussac’s coordinate is therefore 48° 8′ 39.08” N, 069° 42′ 27.81” W.
Backwards
It’s sometimes useful to convert a position expressed in degrees/minutes/seconds to the decimal system. This conversion is sometimes useful because some electronic positioning systems operate in the decimal system.
For example, Google Maps uses a decimal position system. If we look at the URL for Quebec City’s position, we should see the coordinates in decimal (image below, boxed in red).
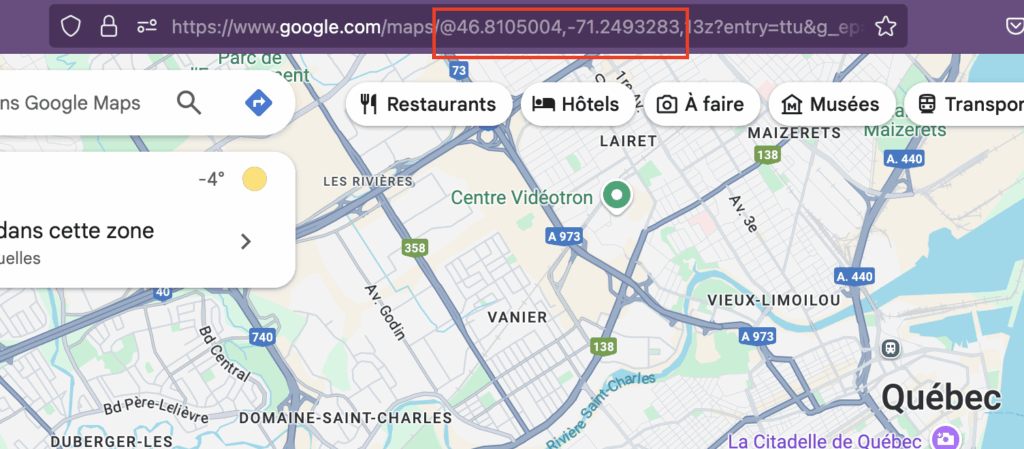
To convert backwards, we take the part in seconds and divide by 60. Then add this result to the minutes. We then take this part in minutes, including the added decimal part, and divide it again by 60. This gives us the decimal part of degrees. We then add to the degrees to obtain the complete coordinate.
Third example
Convert the data for Quebec City (46° 48′ 37.8” N, 071° 14′ 57.58” W) into decimal coordinates.
Solution:
- For the North component:
- There are 37.8 seconds which are divided by 60, giving 0.63. This is added to the minutes, giving 48.63 minutes.
- Take these 48.63 minutes and divide by 60, giving 0.8105 degrees.
- Add the degrees and you get 48.08105° N.
- For the western component:
- There are 57.58 seconds divided by 60, giving 0.9597. This is added to the minutes, giving 14.9597 minutes.
- Divide these minutes by 60 to obtain 0.2493 degrees.
- Add to degrees to obtain 71.2493° W.
In short, the decimal coordinates of Quebec City are 48.08105° N, 071.2493° W.
Fourth example
The city of Nassau, Bahamas, is at coordinates 25° 3′ 35.9964” N, 077° 20′ 42.0036” W. Convert these coordinates to decimal systems.
Solution:
- For the North component:
- 35.9964 divided by 60 gives 0.5999. There are therefore 3.5999 minutes.
- 3.5999 divided by 60 gives 0.059998. The coordinate is therefore 25.059998° North.
- For the western component:
- 42.0036 divided by 60 gives 0.7001. There are therefore 20.7001 minutes.
- 20.7001 divided by 60 gives 0.3450. The coordinate is therefore 77.3450° West.
In short, the town of Nassau is at coordinates 25.059998° N, 077.3450° W.
Exercises
Convert the coordinates below into degrees, minutes and seconds:
| City | Coordinates | Solution |
| Montreal | 45.4801548 N, 73.4627124 W | 45° 28′ 48.56” N, 073° 27′ 47.78” W |
| Trois-Rivières | 46.3862707 N, 72.5204994 W | 46° 23′ 10.58” N, 072° 31′ 13.80” W |
| Saguenay | 48.4335845 N, 70.9213722 W | 48° 26′ 0.90” N, 070° 55′ 16.94” W |
Convert the coordinates below into decimal positions:
| City | Coordinates | Solution |
| Pointe-à-Pitre | 16° 14′ 28.50″ N 061° 32′ 10.10″ W | 16.2413 N, 61.5361 W |
| Fort-de-France | 14° 35′ 60.00” N, 061° 4′ 59.89” W | 14.6000 N, 61.0833 W |
| Miami | 25° 45′ 42.05” N, 80° 11′ 30.44” W | 25.7617 N, 80.1918 W |
5. Calculating speed, distance and time
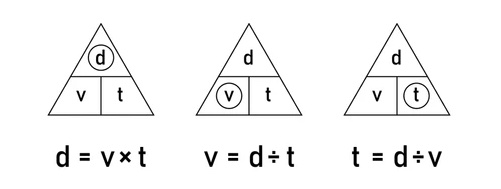
Calculating speed, distance and time is an essential part of navigation. The idea is that we can use these calculations to estimate our future position, or to assess the distance covered. If we note d the distance, v the speed and t duration, you need to be able to perform the calculations below.
- Starting from a speed v and duration t, calculate the distance d. The distance is obtained by multiplying the duration by the speed.
- Starting from a speed v and a distance d, calculate the duration t. The duration is obtained by dividing the distance by the speed.
- Starting from a distance d and a time t, calculate speed v. The speed is obtained by dividing the distance by the duration.
The triangle in the image at the beginning of this section can be useful for remembering the rules associated with each calculation. You can circle the unknown quantity (for example, the distance in the first triangle). If the remaining quantities are on the same level, then multiply them (as in the first triangle). If, on the other hand, the quantities are on two different levels, then divide the one above by the one below (as in the second and third triangles).
It’s not central to remember this triangle. It’s just a memory aid to help you make the right calculations. If these calculations are intuitive, so much the better! The important thing is to arrive at the right answer.
First example
You drive at 100 km/h (“kilometers per hour”) for 3 hours 20 minutes. How far have you travelled?
Solution: We have a speed (100 km/h) and a time (3h 20 min.). Multiply them to obtain the distance covered.
That said, you must first convert the twenty minutes into hours. We divide twenty minutes by sixty to obtain 0.33. So we drive for 3.33 hours. The product of the two gives 333 kilometers.
Second example
You’ve sailed a distance of 50 kilometers for 18 hours. What was your speed along the way?
Solution: we have a distance and a time. So we divide the distance by the time to get the speed. The result is: 2.78 km/h. That’s a snail’s pace!
Third example
You’ve sailed 100 kilometers at a speed of 11 km/h. How long did it take you to do this?
Solution: we have a distance and a speed. We divide the distance by the speed to obtain the time, i.e. 9.09 hours. We need to convert the .09 hours into minutes. This is done by multiplying by 60 to obtain 5.45 minutes, or six minutes if rounded off. The duration is therefore 9 hours 6 minutes.
Distances and speeds at sea
On land, it’s convenient to express speed in kilometers per hour (km/h) and distances in kilometers (km). This is not the case at sea. Distances are expressed in nautical miles (mn, or m) and speeds in knots (kn).
The nautical mile corresponds to 1852 meters (or 1.852 kilometers). Its value is closely associated with the earth’s circumference (one nautical mile is worth about one minute of angle at the equator). You need to know this definition and know how to use it to measure distances.
Similarly, speed is expressed in knots, the number of nautical miles per hour. A speed of one knot means 1 nautical mile per hour, 5 knots means 5 nautical miles per hour, and so on.
The speed calculations are the same as in the previous exercises, but are now done using knots and nautical miles.
Fourth example
You are sailing in a straight line at a speed of 6.3 knots. Your sailing time is 3 hours 15 minutes. What distance have you covered in nautical miles? What is this distance in kilometers?
Solution: we have a speed and a time. Multiply the two to obtain the distance. However, you have to convert the minutes into hours to do the multiplication. Dividing the 15 minutes by 60 gives 0.25. This gives a duration of 3.25 hours. Multiplying the speed by 3.25 gives the distance covered in nautical miles, i.e. 20,475 nautical miles. If we multiply this value by 1.852, we obtain the distance in kilometers, i.e. 37.92 kilometers.
Fifth example
You’ve been sailing in a straight line for 5 hours. You’ve covered 18 nautical miles. What is your speed in knots?
Solution: we have a time and a distance. Divide the distance by the time to obtain the speed in knots, i.e. 3.6 knots.
Sixth example
You’ve sailed in a straight line for 5.0 knots. You’ve covered 15 nautical miles. How long was your journey?
Solution: We have a distance and a speed. Divide the distance by the speed to find the elapsed time, which is exactly 3 hours.
Exercises
- By river, the distance between Tadoussac and Rimouski is about 55 nautical miles. Assuming an average speed of 5.0 knots, how long will it take you to make the trip? (Answer: 11 hours).
- You sailed from Brandy Pot to Tadoussac in 4 hours. Knowing that you were sailing at 4.9 knots, how far did you travel? (Solution: 19.8 mn).
- The crossing between Gaspé and Étang-du-Nord (Îles-de-la-Madeleine) is 134 nautical miles. Knowing that you have a full day to make the crossing, identify the average speed you need to make to arrive on time (Answer: 5.6 kn).
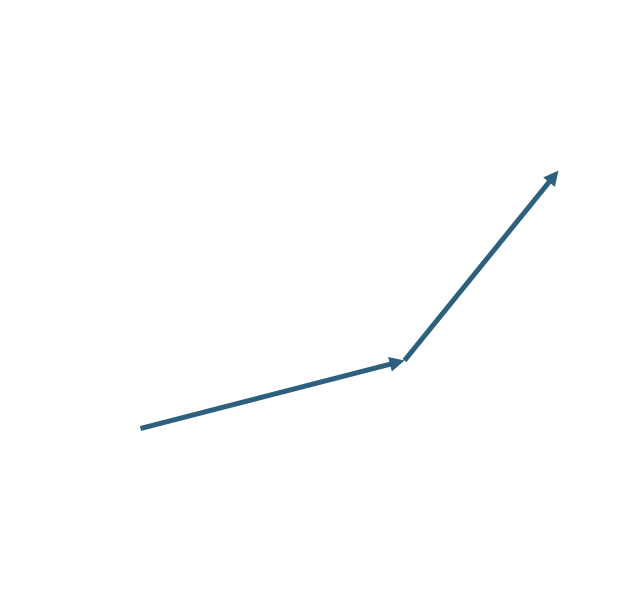
6. Interpolation and extrapolation

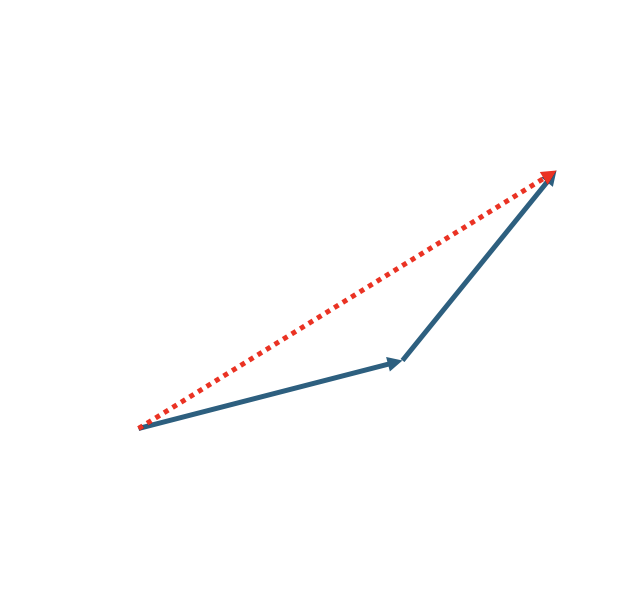
Interpolation involves predicting the value of an unknown quantity from adjacent known quantities. The etymology reveals the meaning, as “inter” means “between” and “pol” means “points”, so it’s an estimate “between the points”. The image above the section sums up the idea: the blue lines are estimates based on the red dots.
The need to fill in missing data is everywhere in navigation. These gaps often arise from the need to present information concisely. For example, on a navigation chart, you can’t write the depth at every point. Otherwise, the map would be illegible! So you have to fill the gap and deduce an approximate depth value from adjacent values.
The same applies to tides. We generally know the time of tides at certain times, but for other times, we need to estimate the height of the tide (using interpolation techniques).
Finally, we can also consider currents, which are not indicated at every point on a map. In this case, you need to interpolate from two known data points.

Extrapolation is so important in navigation that when it’s applied to position prediction, it’s given its own name: dead reckoning. As the etymology of the name suggests, extrapolation consists in estimating an unknown quantity “outside” (extra) known points (“pol”). The most common form of extrapolation involves using the boat’s speed and course to estimate its future position.
Interpolations and extrapolations give estimated values. They should therefore be used with a healthy reflex of caution, particularly when the values may have an impact on safety. Interpolation assumes that the estimated values vary in a predictable and constant manner between the two known points. If this is not the case, the estimated value will necessarily be wrong! Extrapolation assumes that the trend of the last few hours will not change in the future. If this is not the case, the estimate will also be wrong.
First example
You consult your nautical chart and know that 30 meters ahead of your boat, the depth is 10m. You also know that 10 meters behind your boat, the depth is 5 meters. What is your estimated depth?
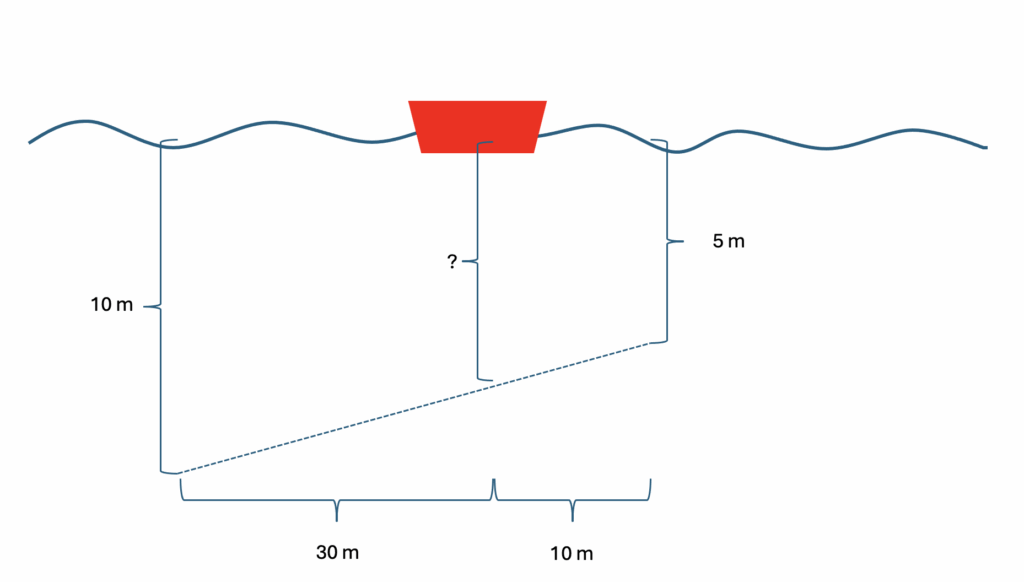
Solution: the idea is to establish the rate of progress over the distance between the two known points. Over a distance of 40 meters, the depth varies by 5 meters. Consequently, the interpolated variation is 0.125 meters of depth per meter of distance. As we are 30 metres from the deepest point, we can estimate that the depth will decrease by 0.125 x 30, or 3.75 metres. Subtract these 3.75 metres from the initial depth (10 – 3.75) to obtain the estimated depth. The interpolated depth is thus 6.25 meters.
Second example
The tide level will be 3 meters at noon. One hour later, at 1:00 pm, it will be 2.25 meters. What would be an estimate of the tide level at 12:45?
Solution: we need to establish the rate at which the tide progresses over the hour. The tide decreases by 0.75 meters in an hour. Its “speed” is therefore a decrease of 0.75 meters per hour. Forty-five minutes corresponds to three-quarters of an hour, or 0.75 hours. Consequently, the tide will have decreased by 0.75 x 0.75 = 0.56 metres. This value must be subtracted from the initial tide height to obtain the interpolation, i.e. 2.44 metres.
Note that interpolating tides is a good idea if the time interval is small. Otherwise, the interpolation will not approximate real tidal behavior.
Third example
Your log (an “odometer”) indicates a distance traveled of 50 nautical miles at 1:30 pm. At 2:30 p.m., the loch indicates a distance covered of 56 nautical miles. If you keep up your pace, what distance will the loch show at 7:00 pm?
Solution: establish a pace based on the two data points. Then extrapolate this pace to 1900. Between 1:30 and 2:30 pm, an hour passed and a distance of 6 nautical miles (56 – 50) was covered. Consequently, the boat’s speed was 6 knots (6 nautical miles divided by one hour gives six knots). Between 14:30 and 19:00, there are 4.5 hours. Consequently, if the speed remains the same, we can estimate 27 nautical miles (4.5 x 6 = 27). These 27 nautical miles must then be added to those covered at 14:30. At 19:00, the loch should show 83 nautical miles.
Fourth example
You’re crossing the Atlantic at 125 nautical miles per day. If you have 1100 nautical miles to go before you reach Guadeloupe, how much longer will you be at sea?
Solution: We already have a measure of progress. Just divide the 1100 nautical miles by 125 to get 8.8 days, or 8 days and 19 hours.
Exercises
- The current is estimated at 3 knots six nautical miles ahead of your position. It is estimated to be zero two miles astern of your position. Estimate the current at your position. (Answer: 0.75 knots).
- You have covered 8 nautical miles in the last two hours. You are 6 nautical miles from your port of arrival. When do you expect to arrive? (Answer: in 1 h 30 min.)
- The tide will be 2.86 meters at 1:17 pm and 3.41 meters at 2:42 pm. Estimate the height of the tide at 14:00. (Answer: 3.14 meters).
- An hour ago, the depth under your sailboat was 42 meters. Now it’s 32 meters. If this trend continues, estimate how long it will take for the depth under your sailboat to reach 10 m. (Answer: 2 hours 12 minutes).
7. Vectors, their addition and subtraction
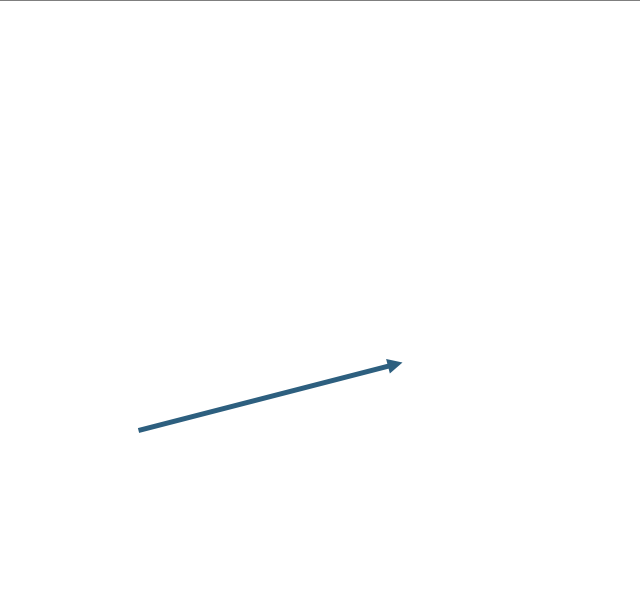
Vectors (and vector fields) are relatively advanced mathematical objects. For navigational purposes, however, we can reduce a vector to one well-known thing: an arrow. An arrow has a size and an orientation.
On the road, it’s common to express speed as a magnitude only. We’re going at 10 km/h, 50 km/h, or any other speed, but it’s implicit that this speed is in the direction of the road we’re traveling on.
In sailing, there is no path, so to fully characterize the speed at which you’re sailing, you have to say how great the speed is (3 knots, 6 knots, etc.) but also in what direction. You could be going 6 knots north, or 5 knots south, and so on. More commonly, direction is expressed as any angle measured from North: we make six knots at 045°, equivalent to North-East. Vectors express both the magnitude and the direction of speed. This is one of the reasons we use vectors.
They are also used to discuss the distance travelled in a particular direction. In this case, the magnitude is the distance covered and the angle indicates in which direction this distance is covered. For example, we may have travelled six nautical miles in a westerly direction. If you think about it, distances represent a velocity vector for which a certain amount of time has elapsed. If we take a time of one hour, then the speed vector will represent the distance travelled by the ship in the direction of the speed.
Adding and subtracting vectors
You need to know how to add and subtract vectors. The simplest method is graphical.
Adding two vectors is done graphically in three steps. These are illustrated below. First, draw the first vector, taking care to measure its length and orientation.
For a vector of six nodes, for example, you can draw a straight line six centimetres long in the appropriate direction. To get the right orientation, use a protractor.
Then place the second vector at the end of the first, taking care to draw its length and orientation. Use the same scale as for the first vector (1 node = 1 centimetre). The last step is to plot the vector corresponding to the beginning of the first vector and the end of the first vector. This is the vector resulting from the addition. We can determine its orientation by reading the appropriate angle with a protractor and measuring its length with a ruler (and remembering the scale we’ve chosen).
Vector addition is very useful for evaluating the combined effect of two speeds. In sailing, this is often the speed of the boat on the water and the speed of the current. By adding them together, we can find the sailboat’s total speed relative to land.
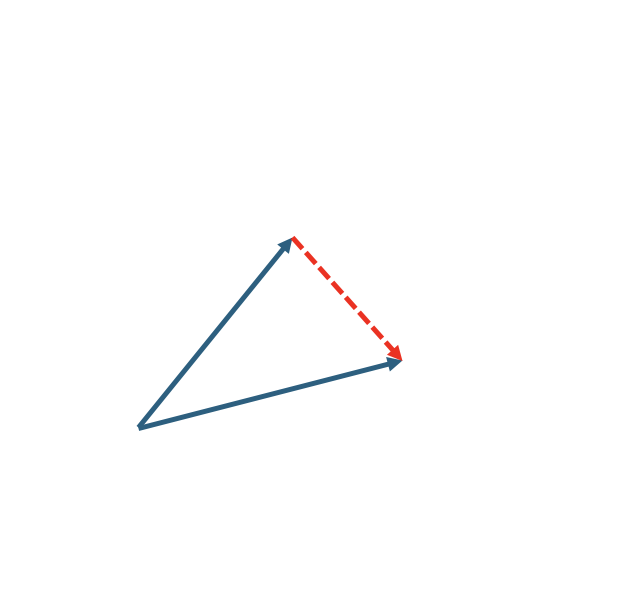
Subtracting vectors
Vector subtraction also works with paper. However, instead of putting the vectors. The method is presented in three steps below.
The first thing to do is to draw the first vector, from which the second is subtracted, and place it at the correct orientation and scale. Then place the second vector from the beginning of the first. Care is also taken to respect its orientation and scale. The vector resulting from the subtraction is then the one that starts at the end of the second vector and ends at the end of the first vector. Care must be taken not to reverse the order. Otherwise, you’ll end up with reverse subtraction.
Vector subtraction is useful for more elaborate navigation constructions, such as determining how to plan a route taking into account the current.
First example
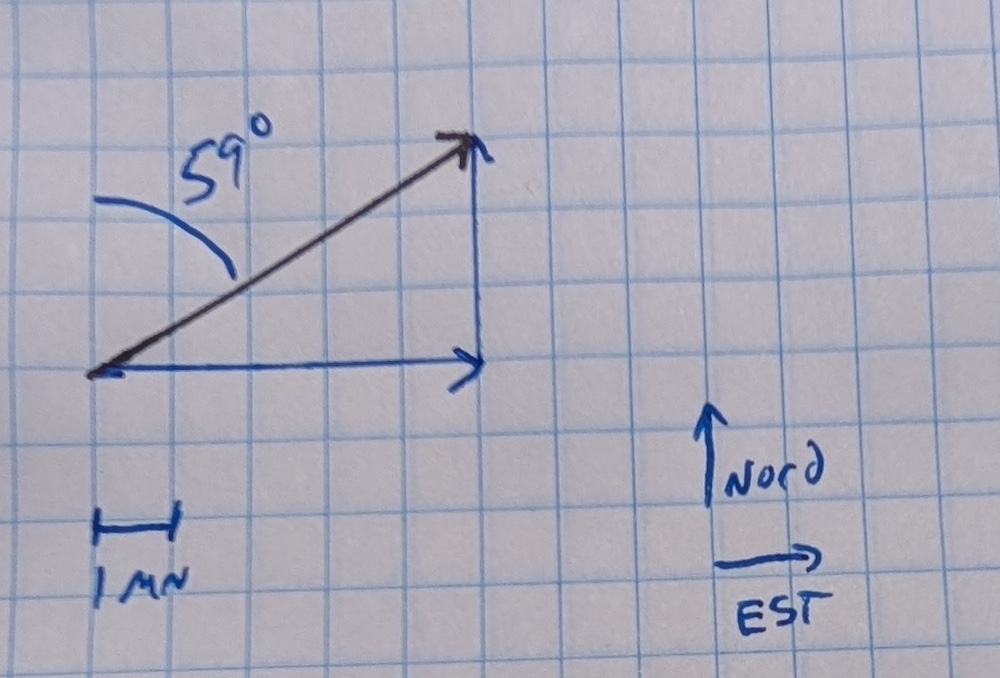
You’ve sailed 5 nautical miles east, then 3 nautical miles north. Calculate the equivalent vector for this displacement.
Solution: it’s an addition of vectors. See the image below. The scale is one square per nautical mile. The equivalent vector is 5.8 nautical miles in length. A protractor would indicate that it is 59° from the vertical line at its starting point, i.e. from North.
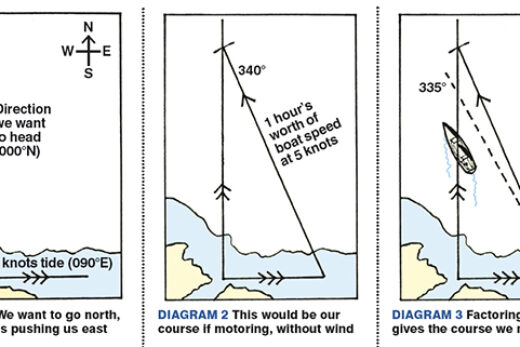
Second example
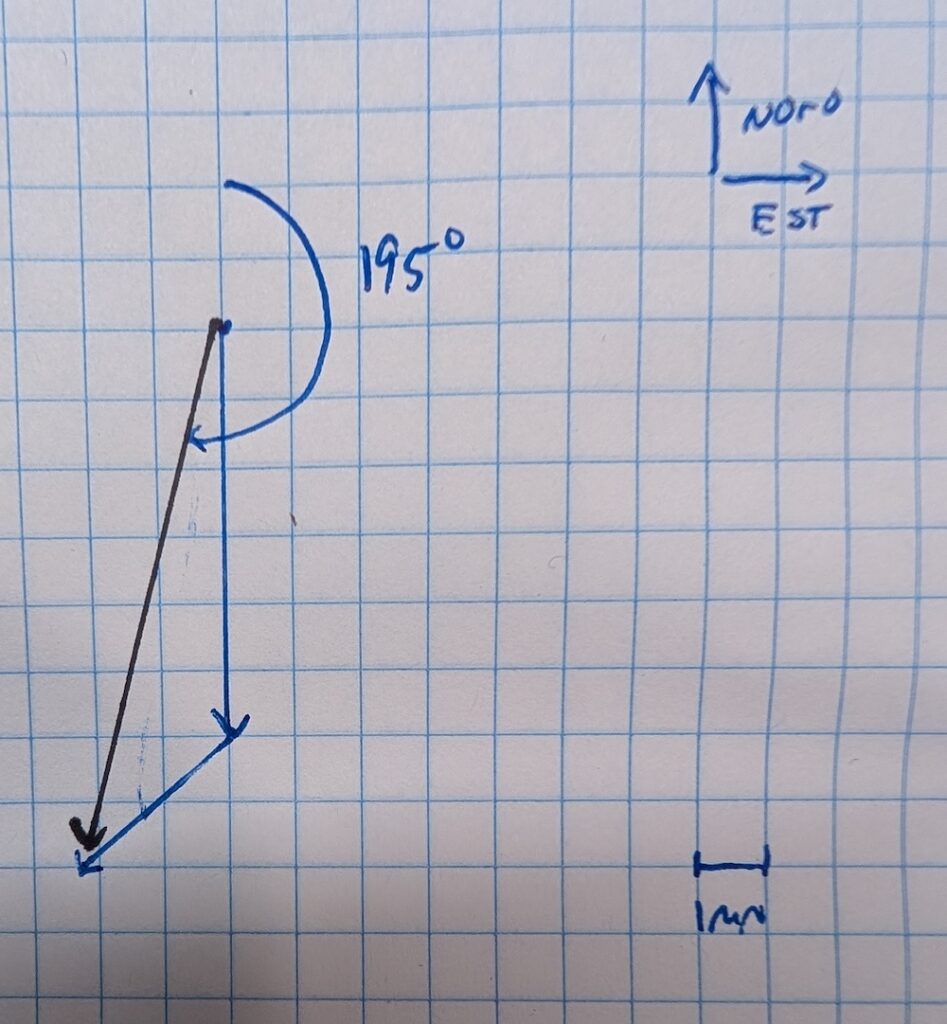
You’re sailing at six knots to the south, but a current of 3 knots is pushing your ship southwest. Calculate your speed, taking the current into account.
Solution: it’s an addition of vectors. See the image below. We should measure a vector of 8.4 knots making an angle of 195° with North.
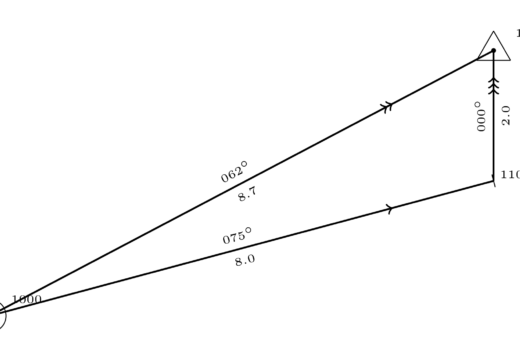
Third example
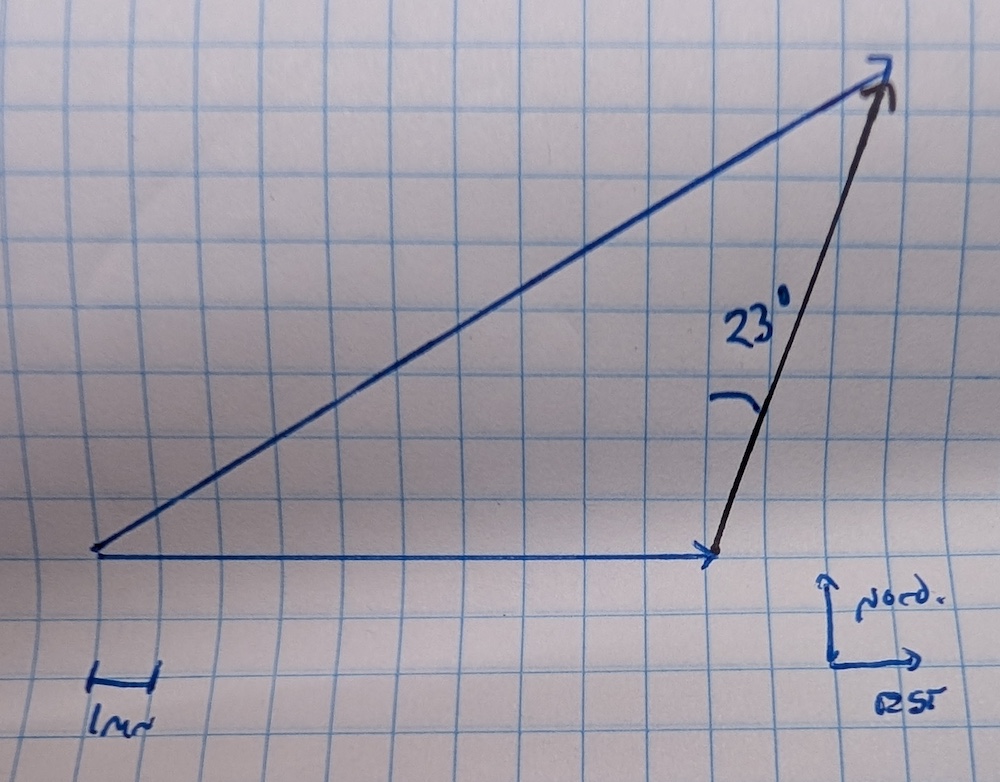
Between your point of departure and your point of arrival, you have covered 15 nautical miles at an angle of 060° from North. However, this distance depends on your boat speed and the current. You know that your boat has covered 10 nautical miles pointing east. What was the magnitude and direction of the current?
Solution: it’s a subtraction of vectors. See the image below, where one square length corresponds to one nautical mile. We want to subtract the 10-nautical-mile vector to the east from the 15-nautical-mile vector to the west. Our first vector is therefore 15 nautical miles 060°. The second vector is 10 nautical miles east. The resulting vector is the one from the second vector to the first vector. We can measure a length of 8.1 nautical miles at an angle of 23°. Although we sailed east, the effect of the current shifted us to the north-northeast.
Fourth example
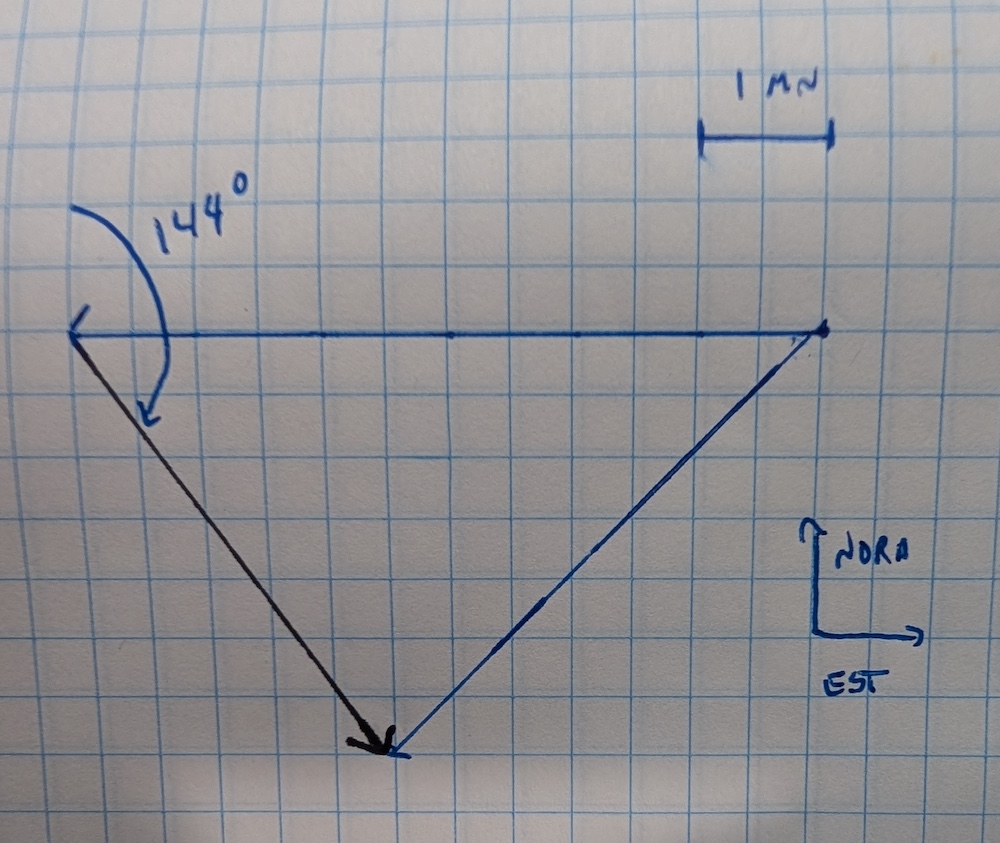
You are sailing at 6 knots on the surface of the water in a westerly direction. However, your speed relative to the shore is 5 knots at 225°. The difference between the two is, of course, the effect of the current. Determine the speed and direction of the current.
Solution: it’s a subtraction of vectors. See image below. Apply the recipe. Subtract the boat’s speed (6 knots West) from the final speed of 5 knots at 225°. We should be able to find a speed of 4.3 knots in the direction of 144°.
Exercises
- You have sailed for 6 nautical miles at 325°, then for 4 nautical miles at 0° (zero being North). Calculate the resultant vector equivalent to this route (Solution: 9.5 mn at 339°)
- Your speed is 6 knots at 275°, but a current of 2 knots carries you to 056°. Calculate your speed vector incorporating the current (Solution: 4.1 kn at 302°)
- If you’re sailing at 6 knots to the east and the current is 3 knots to the west, determine your speed vector (Solution: 3 knots to the east)
- You see that the combined effect of the current and your speed has taken you 10 nautical miles at 045°. You know that your yacht has travelled 8 nautical miles at 060°. Identify the displacement attributable to the current (Solution: 3.1 kn at 003°)
8. Vector fields

The name says it all: a field of vectors. In practice, it’s a nautical chart with vectors at every point. Well, not every point, but as many as practically possible. You have to make the effort to imagine that, even if they aren’t drawn everywhere, there are vectors at every point on the chart.
These vectors will most often indicate the speed of the two most important things under sail: wind and current. It’s not our job to draw them, or to add them up, but it will be our job to interpret the vector fields we’re presented with. Three examples are important.
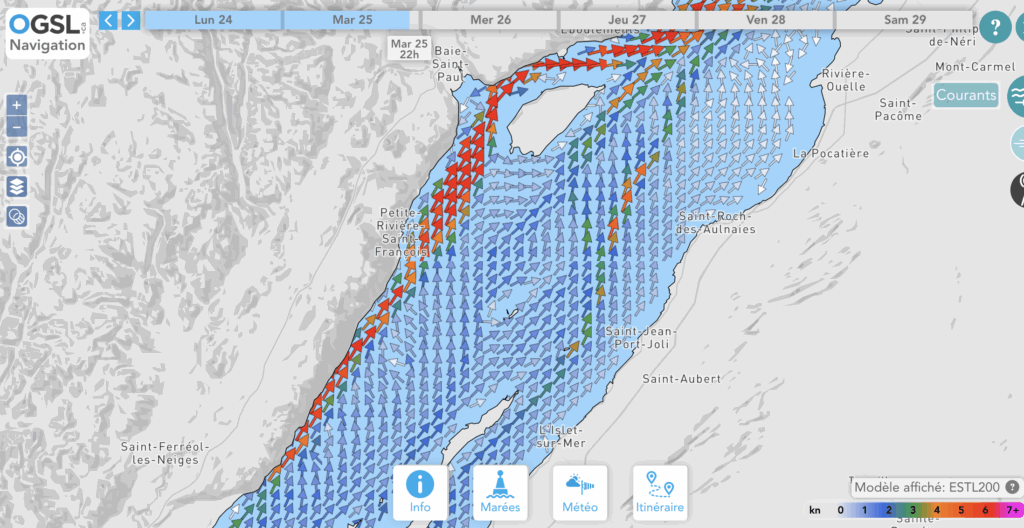
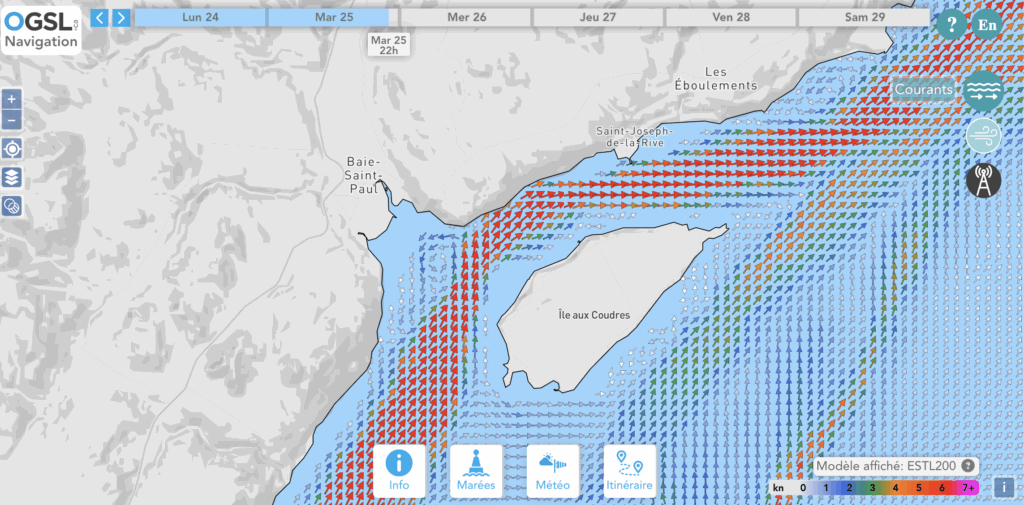
The currents presented by the St. Lawrence Global Observatory
By default, the navigation home page of the St. Lawrence Global Observatory shows the river’s currents in real time (screenshot above). At each point on the river, you’ll see an arrow indicating the magnitude and direction of the current. The vectors are even colored to make speed easier to discern.
The speed color scale is shown at bottom right. Note that along the north coast, currents are strong between Baie-St-Paul and Île aux Coudres. In fact, if we enlarge the map to get a better view of this region, two effects become apparent. Firstly, the number of vectors increases, illustrating the idea that there are vectors at every point. Secondly, current eddies appear in Baie-Saint-Paul.
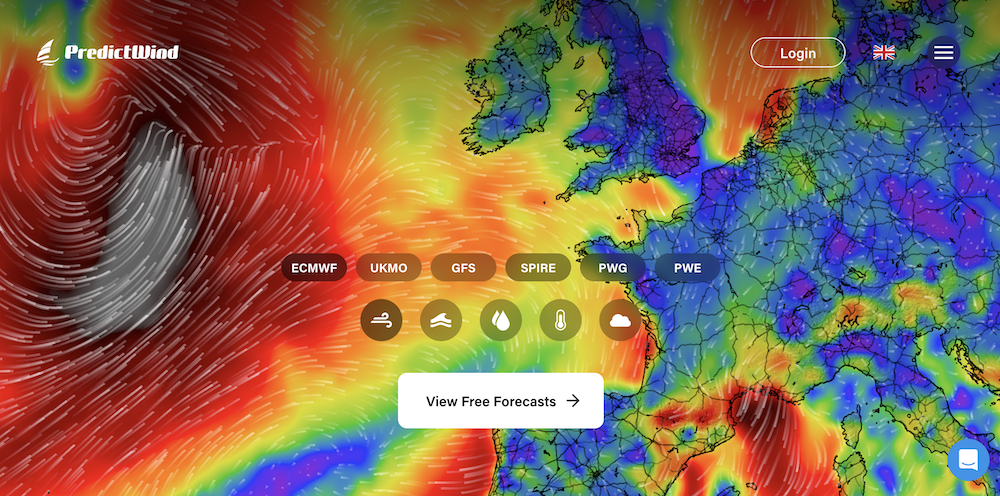
Windy and PredictWind applications
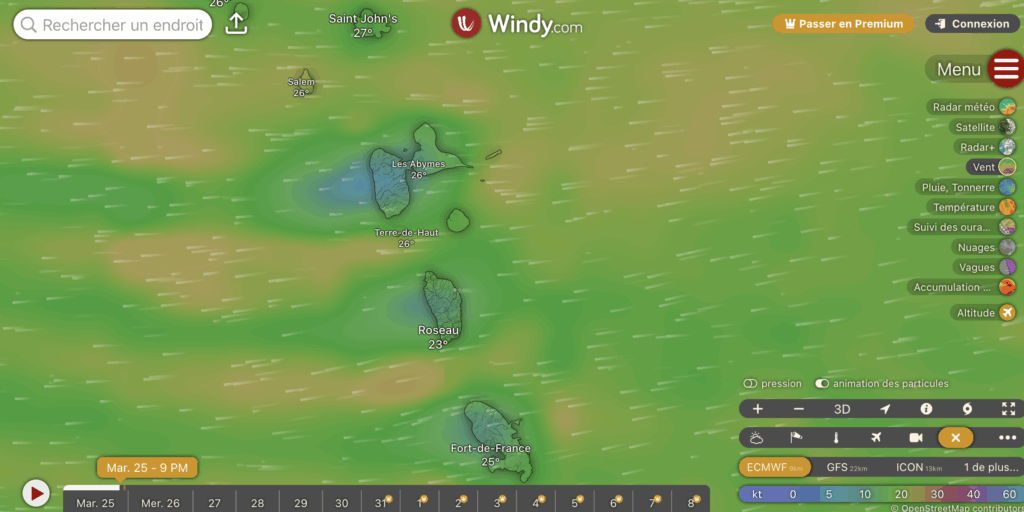
As their names suggest, the Windy and PredictWind applications provide wind speed forecasts. The presentation is a little more stylized: the vectors are presented by animations, allowing the wind direction to be clearly visualized. The magnitude of the vectors is shown in color: the redder, or even mauve, the stronger the winds. A wind scale, in knots, is shown at the bottom of the screen.
St. Lawrence River Current Atlas
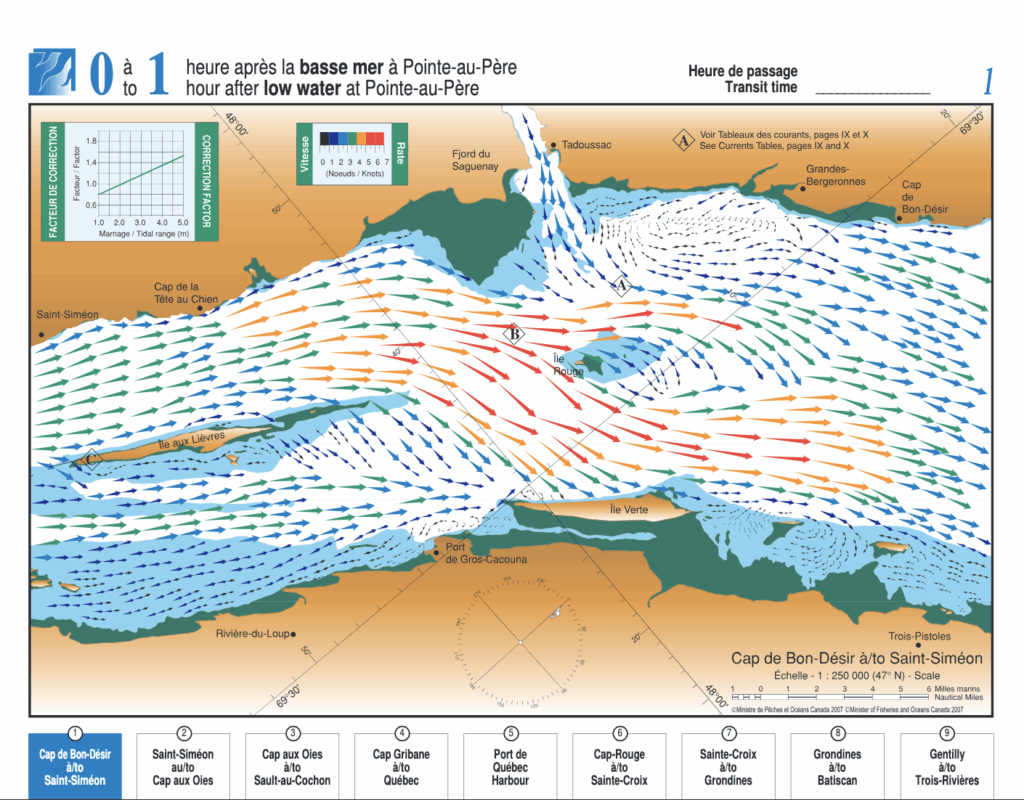
The St. Lawrence River Current Atlas is the paper version of the St. Lawrence Global Observatory. It shows current vectors according to the time of the tide at Pointe-au-Père (Rimouski). You have to scroll through the pages to see the changes in currents from hour to hour.
It’s a little less dynamic than a real-time web page, but all the information you need for navigation is there. The conventions are much the same: vectors are oriented to indicate the direction of the current, and the colors – or the size of the arrows – give an idea of the magnitude. A scale in the top left-hand corner indicates corrections to be made according to the type of tide experienced. How to make these corrections is beyond the scope of this text.
Exercises
Play with the Observatory, Windy, PredictWind and Current Atlas pages. Ultimately, you should be able to read the direction and strength of currents or winds, depending on the document, and not be too afraid of the concept of “vector field”. This reading ability will become crucial in trip-planning exercises. You need to know how to decode winds and currents!
Conclusion
The aim of this text is to ensure that anyone seeking to take a coastal navigation course masters all the fundamentals required for success. The more comfortable you become with these concepts, calculations and ideas, the more you’ll be able to “get your head out of the math” and get on with what really matters: planning a safe and enjoyable cruise.
If you enjoyed this text, please note that there are several others in the “Learning” section aimed at strengthening your sailing skills.
2 Responses
[…] position of a ship (the red arrowhead) and the port of Gros-Cacouna. The distance displayed is 1 nautical mile(1.0 NM). This distance is displayed because the pins coincide with the ship’s position […]
[…] an electronic navigation application. All you need to do is download an application that displays longitude and latitude coordinates. Of course, you’ll need to know how to transfer this information to a paper […]